fp&A resources
2026 SaaS & AI benchmarks report + interactive tool
The definitive 2026 performance benchmark for software and AI, drawn from 342 companies with five years of trend data.

What's Inside
Software companies got more profitable and less defensible in 2025. See what's actually happening underneath the recovery, and what separates the top quartile from the median in 2026.
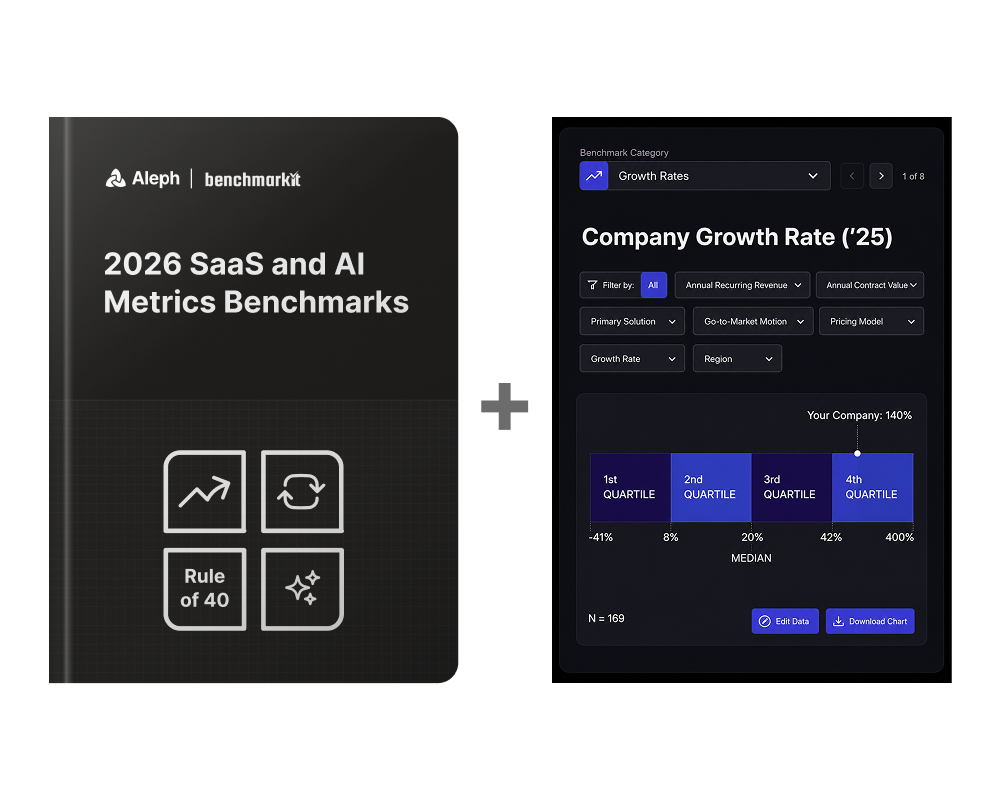
- An interactive benchmarking tool: Filter every metric by your ARR, contract size, GTM motion, and pricing model
- Why the efficiency recovery is fragile: Efficiency improved more than it has in five years, while gross retention dropped 4 points at every quartile
- The full metric stack: CAC payback, NRR, Rule of 40, ARR per employee, and the four-year trend underneath each
- AI maturity and monetization: 60% of companies just shipped AI in the last 24 months, and most still aren't charging for it
Get the report
Get comprehensive benchmark data behind SaaS and AI-native performance in 2026.
Build and scale a top-performing FP&A team
Top-performing FP&A teams trust Aleph to minimize busywork and maximize impact with the power of a web app, the flexibility of spreadsheets, and the magic of AI.
WEB APP
Spreadsheets
AI

Discover Aleph today
Contact us and learn how Aleph can help you build your one source of truth for financial data


