SOLUTIONS

Less friction for portcos, faster value creation across your portfolio

Aleph gives GPs a live line of sight across the portfolio, without asking portcos to change how they work.

Dotted grid
Trusted by portfolio companies at leading PE-firms
1 source of truth for portco data

Our no-code, low-lift platform is ready to use in days, not weeks or months—no engineers or data scientists required.

Cleaner data = faster decisions

Use shared definitions and templates across every portco to compare performance, spot issues sooner, and act with confidence.

Scalable customization

Track what matters to each portco while maintaining a unified reporting layer. Strike the right balance between flexibility and scalability.

“The Aleph team’s experience on the other side of the table is a big selling point. They understood the challenges of PE-backed reporting needs and knew exactly what private equity portfolio companies needed to do.”

Jeff Berry,
CFO
Man with dark hair wearing a blue blazer and white shirt smiling indoors.

Accelerate value creation across your portfolio

Combine the power of a connected data layer, portfolio-wide standardization, and real-time insight to accelerate value creation across every company you own.

Dotted grid
Executive dashboard displaying financial metrics including total revenue $95M, total COGS $28.5M, gross margin 70%, and runway 22 months, with tables and charts for profit & loss details, revenue by segment, and forecast vs. actuals waterfall.
Dotted grid

Most PE tools create work for portcos. Aleph reduces it.

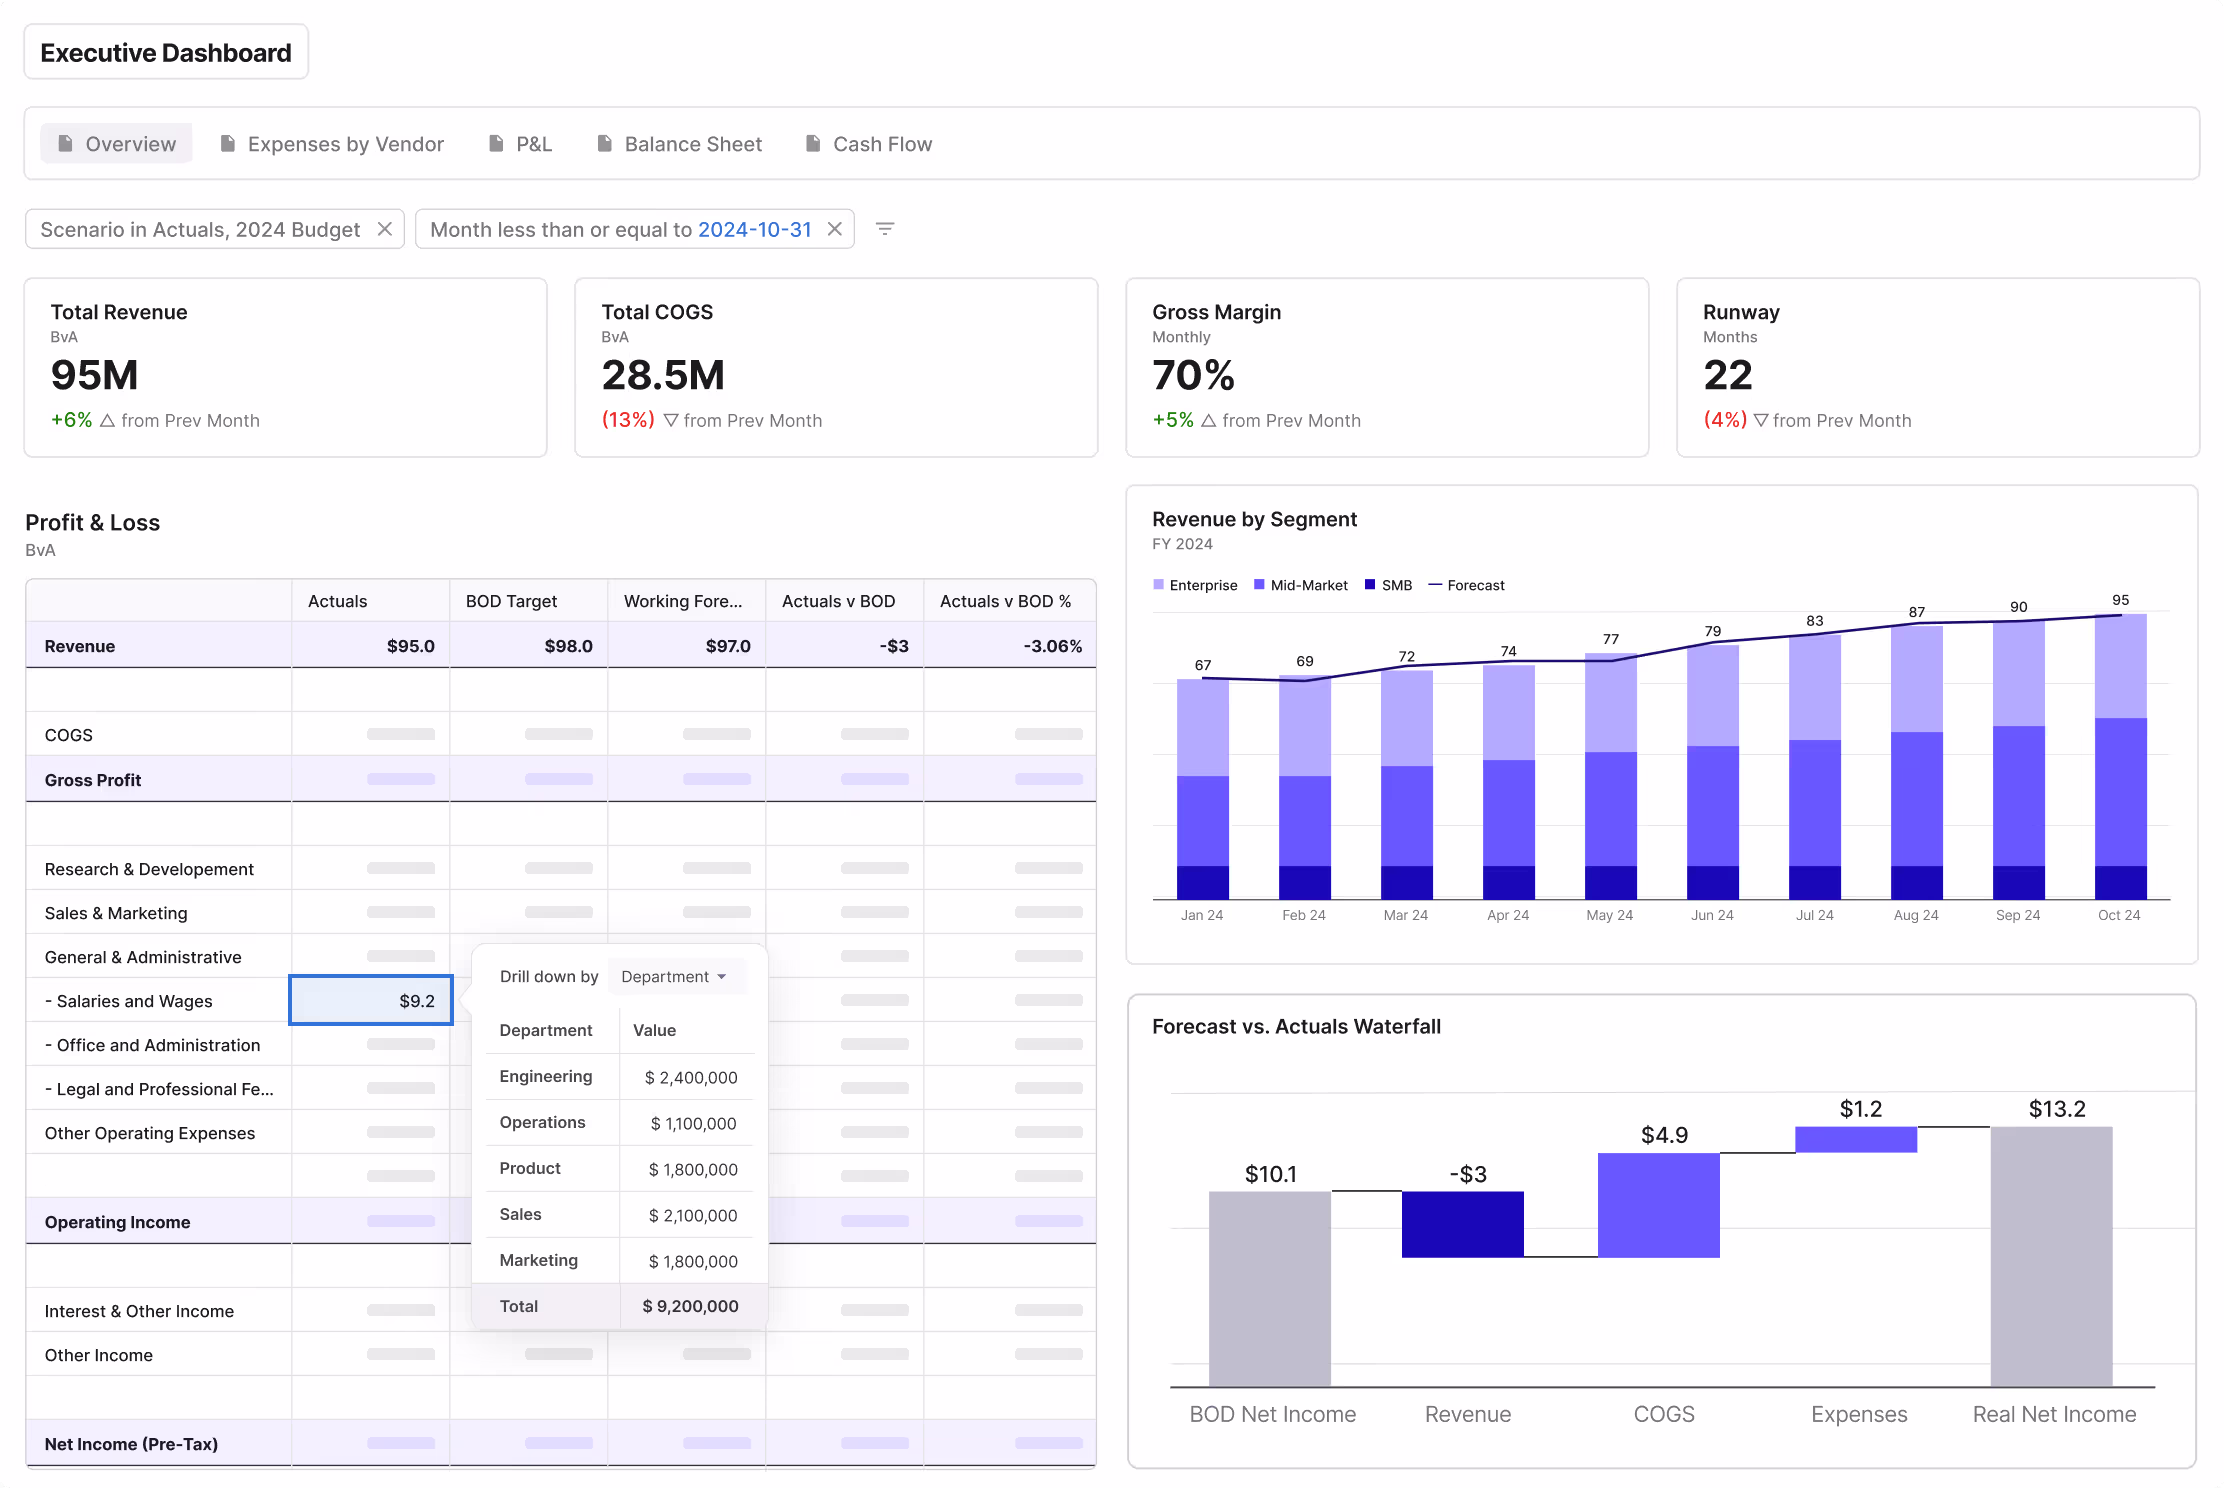
Portcos run their forecasting and reporting in Aleph, and your fund gets live dashboards as a byproduct.

  • No duplicate reporting
  • Portcos stay in Excel
  • Fund gets real-time visibility
Logos of data integration platforms and software arranged around a central white icon on black background, including Xero, QuickBooks, Google Sheets, Airtable, Asana, Salesforce, Excel, Shopify, HubSpot, ADP, and others.
Dotted grid

Every portco is different. Aleph adapts to each one.

Your playbook, KPIs, and templates roll out portfolio-wide without forcing portcos into rigid systems.

  • Works with any ERP, CRM, or spreadsheet
  • Aligns KPIs and logic across companies
  • Delivers clean, comparable data automatically
Interface showing Aleph app with budget vs actuals menu and an Excel income statement table highlighting SaaS Revenue budget of 3,980,892 and actuals of 4,308,281 marked TRUE for materiality; a note below states AI variance analysis attributing sales increase mostly to Americas (+320k) and EMEA (+15k) with a link for supporting drill down.
Dotted grid

Real-time answers without the back-and-forth

Aleph replaces late-night scrambles with instant drill-downs and AI-powered variance analysis.

  • Explain changes in seconds
  • Cut manual checks and rework
  • No more “can you walk me through this?” emails
  • Instantly drill down into underlying data to understand every movement
Dashboard interface showing a stacked bar chart of monthly budgets by departments for 2022 with options to export or sync data to Gmail, Slack, PowerPoint, and Google Slides. The chart includes categories: Engineering, ACME Labs, Data Engineering, and Security.
Dotted grid

A reporting layer built for LPs

Automated rollups, portfolio templates, and exit-ready data come straight from portcos’ live models.

  • One-click portfolio rollups
  • Investor-grade templates
  • Data that’s audit- and diligence-ready

“I've gotten really high praise from my board for the weekly reports and dashboards that I built using Aleph and Excel, and published out to them.”

Brandon Sullivan,
CFO
Smiling bald man with a beard wearing a navy blazer and white shirt against a black background.

Discover Aleph today

Contact us and learn how Aleph can help you build your one source of truth for financial data
G2 badge for software that is the easiest to administrate
G2 badge for software that is a grid leader in their category
G2 badge for software delivering the best results
G2 badge for software users are most likely to recommend
Screenshot of an income statement spreadsheet comparing revenue, cost of revenue, and operating expenses for Jan 25 and Feb 25, alongside a sidebar menu with options including 'Income Statement,' 'Analyze with AI,' and other budget categories.
Dotted grid