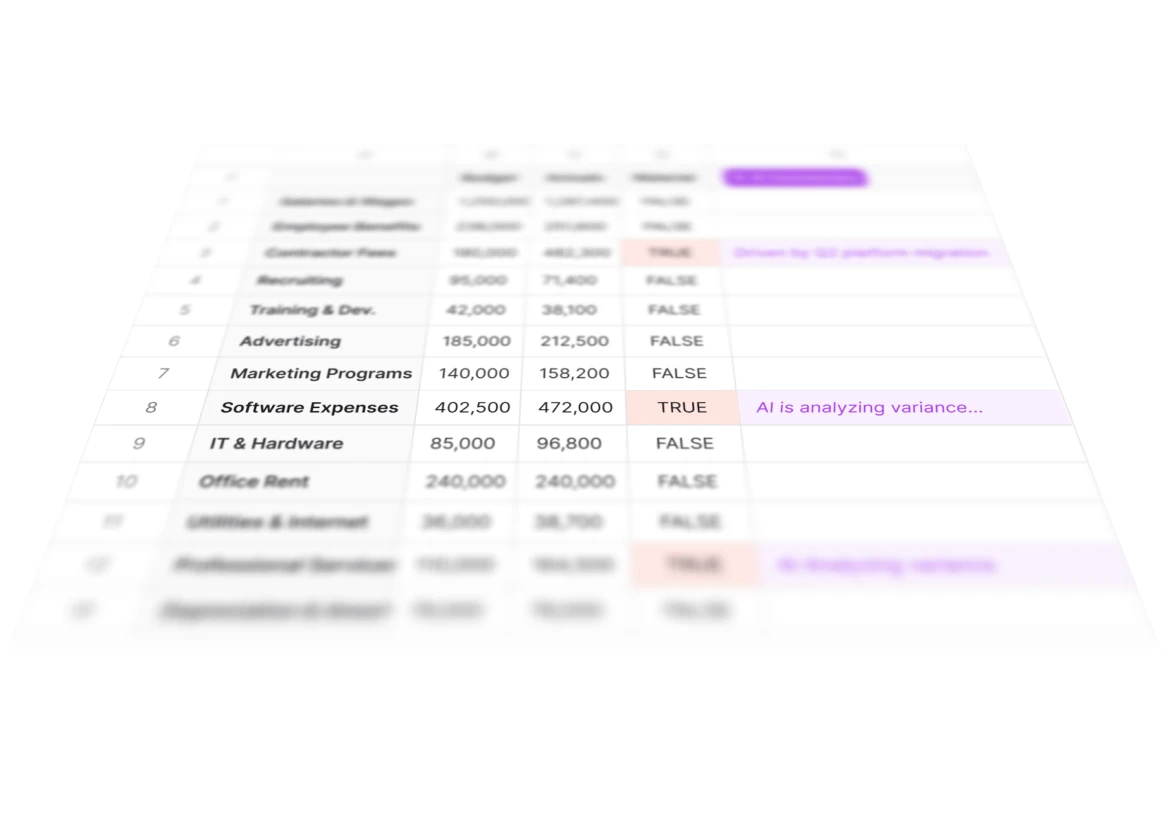
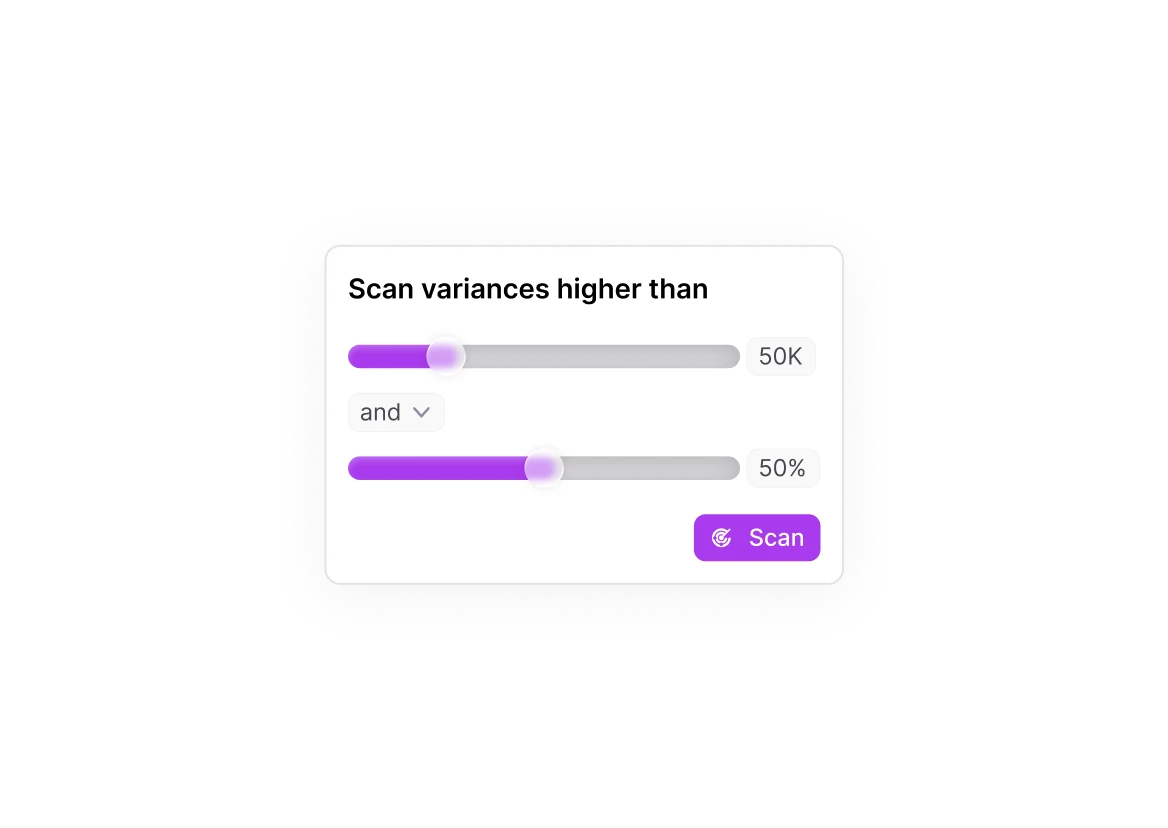
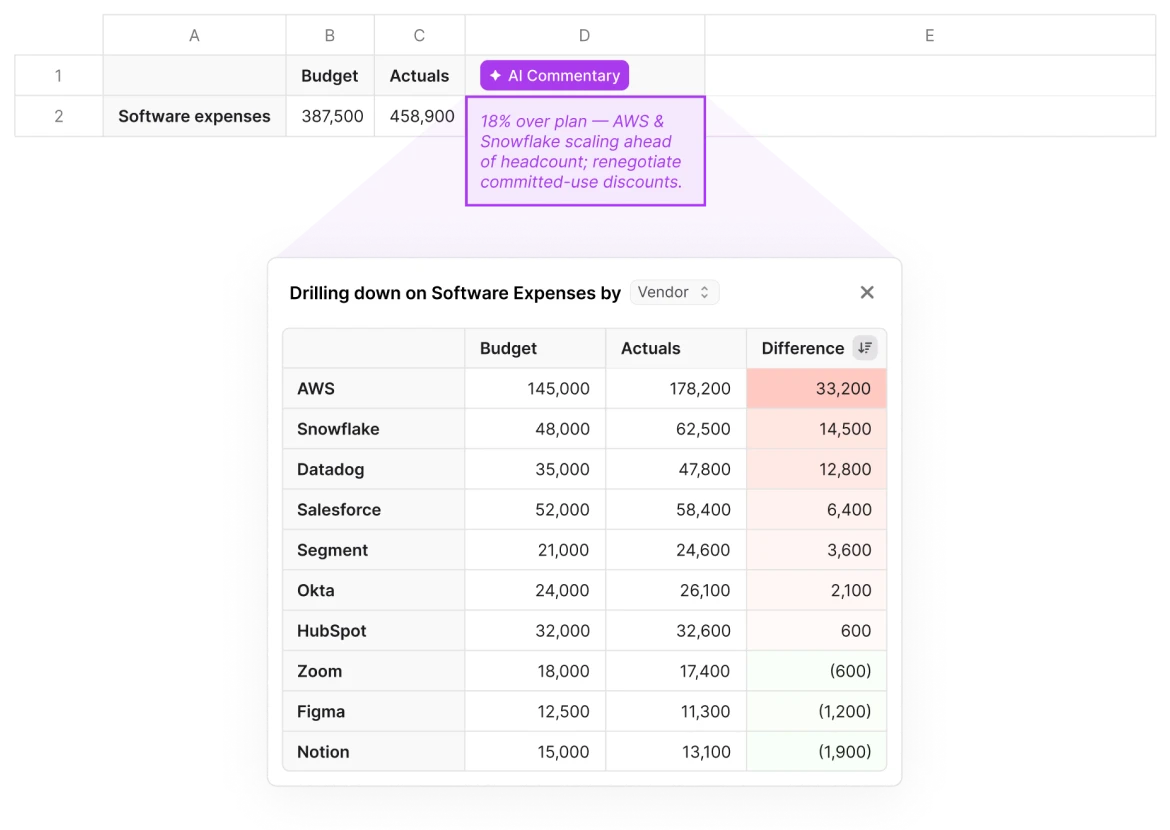
to begin with, this is just like a normal LF Explorer. So if you look into it, what I'm doing here is I'm just bringing by account, by month, for a few months, my financials, and I'm adding here these calculated items of the difference and difference percent. If I pull this, it's, you know, normal non AI left functionality. And then the what you can do with this new feature is add like an AI variance analysis to it. So if I come here and I select pull and scan, I can choose my threshold for what's material, and I can give it a go. This will pull date again. It will signal which are the columns that have material differences based on our threshold. So here you see, we have, like, five or seven. And from there, it's gonna go one by one. And what's it doing in the background, and this takes, you know, between forty five seconds and a minute, is is taking each of these. So let's say legal services, it's doing a drill down by different, dimensions. So it's coming and saying, okay. I'm gonna do it by department. I'm gonna do it by class. And then it's aggregating all of that up. So one of the things that they do in background is something like this, where you see we have quite a bit of vendor level detail. And now we finish, and you can see if I choose that same sample, it's a very simple one. The overall difference is one seven point three, and then there was one vendor, particularly, Lee and Associates that explains most of the difference, and that's what the AI surfaced. The idea is that not only the AI surfaces this, but also it's very easy to check its work. So if you select and you try to do the same drill down again, it will automatically suggest that vendor name is the dimension that would make this interesting. Two other things to highlight. So this works with other you know, every other, dimension. Here you see that we're doing it by location. But the the two things that are, interesting to highlight on top of that is, one is this one, that if the AI doesn't find something interesting, it won't hallucinate. It will just tell you, I couldn't find anything interesting. The other thing that is, worth highlighting is in a case like this one where we have events and retreats. If I do many, many drill downs, nothing will be interesting. And the best one will be transaction memo. But if I do the transaction memo drill down, that is the one that the AI is going to suggest in this case. I will also see that there's a lot of transaction level detail that is not very structured. But I do see that if I can go and filter, I will see certain themes, and I will see that there's a lot of expenses, roughly thirty nine k, that are tagged with retreat. And that is what the AI did. It says that if I'm grouping, if I'm going to all of these detail and saying there's a lot of these are retreat, I see that there's thirty seven k, from thirty two lines related to retreats. So you don't necessarily need the perfect data for this to make sense. You can also take advantage of the idea of AI doing that cleaning and that grouping for you on the flight.