Data Consolidation

Transform raw data into ready to use data—all in real time

Build a single source of truth that is purpose-built for how modern finance teams need to organize, structure, and work with their data.

Diagram showing data sources like ERP & Accounting, HRIS & ATS, CRM & Billings, Data Warehouses, Spreadsheets feeding into a platform with AI Mappings, Calculated Items, Shared Dimensions, Custom Metrics, Automations, AI Calculated Tables, Access Control, and Data Checks, with outputs to Excel & Google Sheets and Web App & Dashboards.
Dotted grid
Trusted by industry-leading finance teams
Be up and running in days

Our no-code, low-lift platform is ready to use in days, not weeks or months—no engineers or data scientists required.

Give logic a place to live

Give your data structure and purpose with smart logic to combine tables, run calculations, store metrics, and more.

Keep data safe and secure

Keep your data safe and your compliance team happy with access controls, fine-grained permissions, and audit logs.

Aleph dashboard displaying a table list with names, column counts, and last updated dates including NetSuite Income Statement, Cash Flow, Rippling Headcount, Greenhouse Jobs, Income Statement, Stripe Invoices, Input OPEX, and Input Revenue.
Dotted grid

Plug directly into your existing tech stack

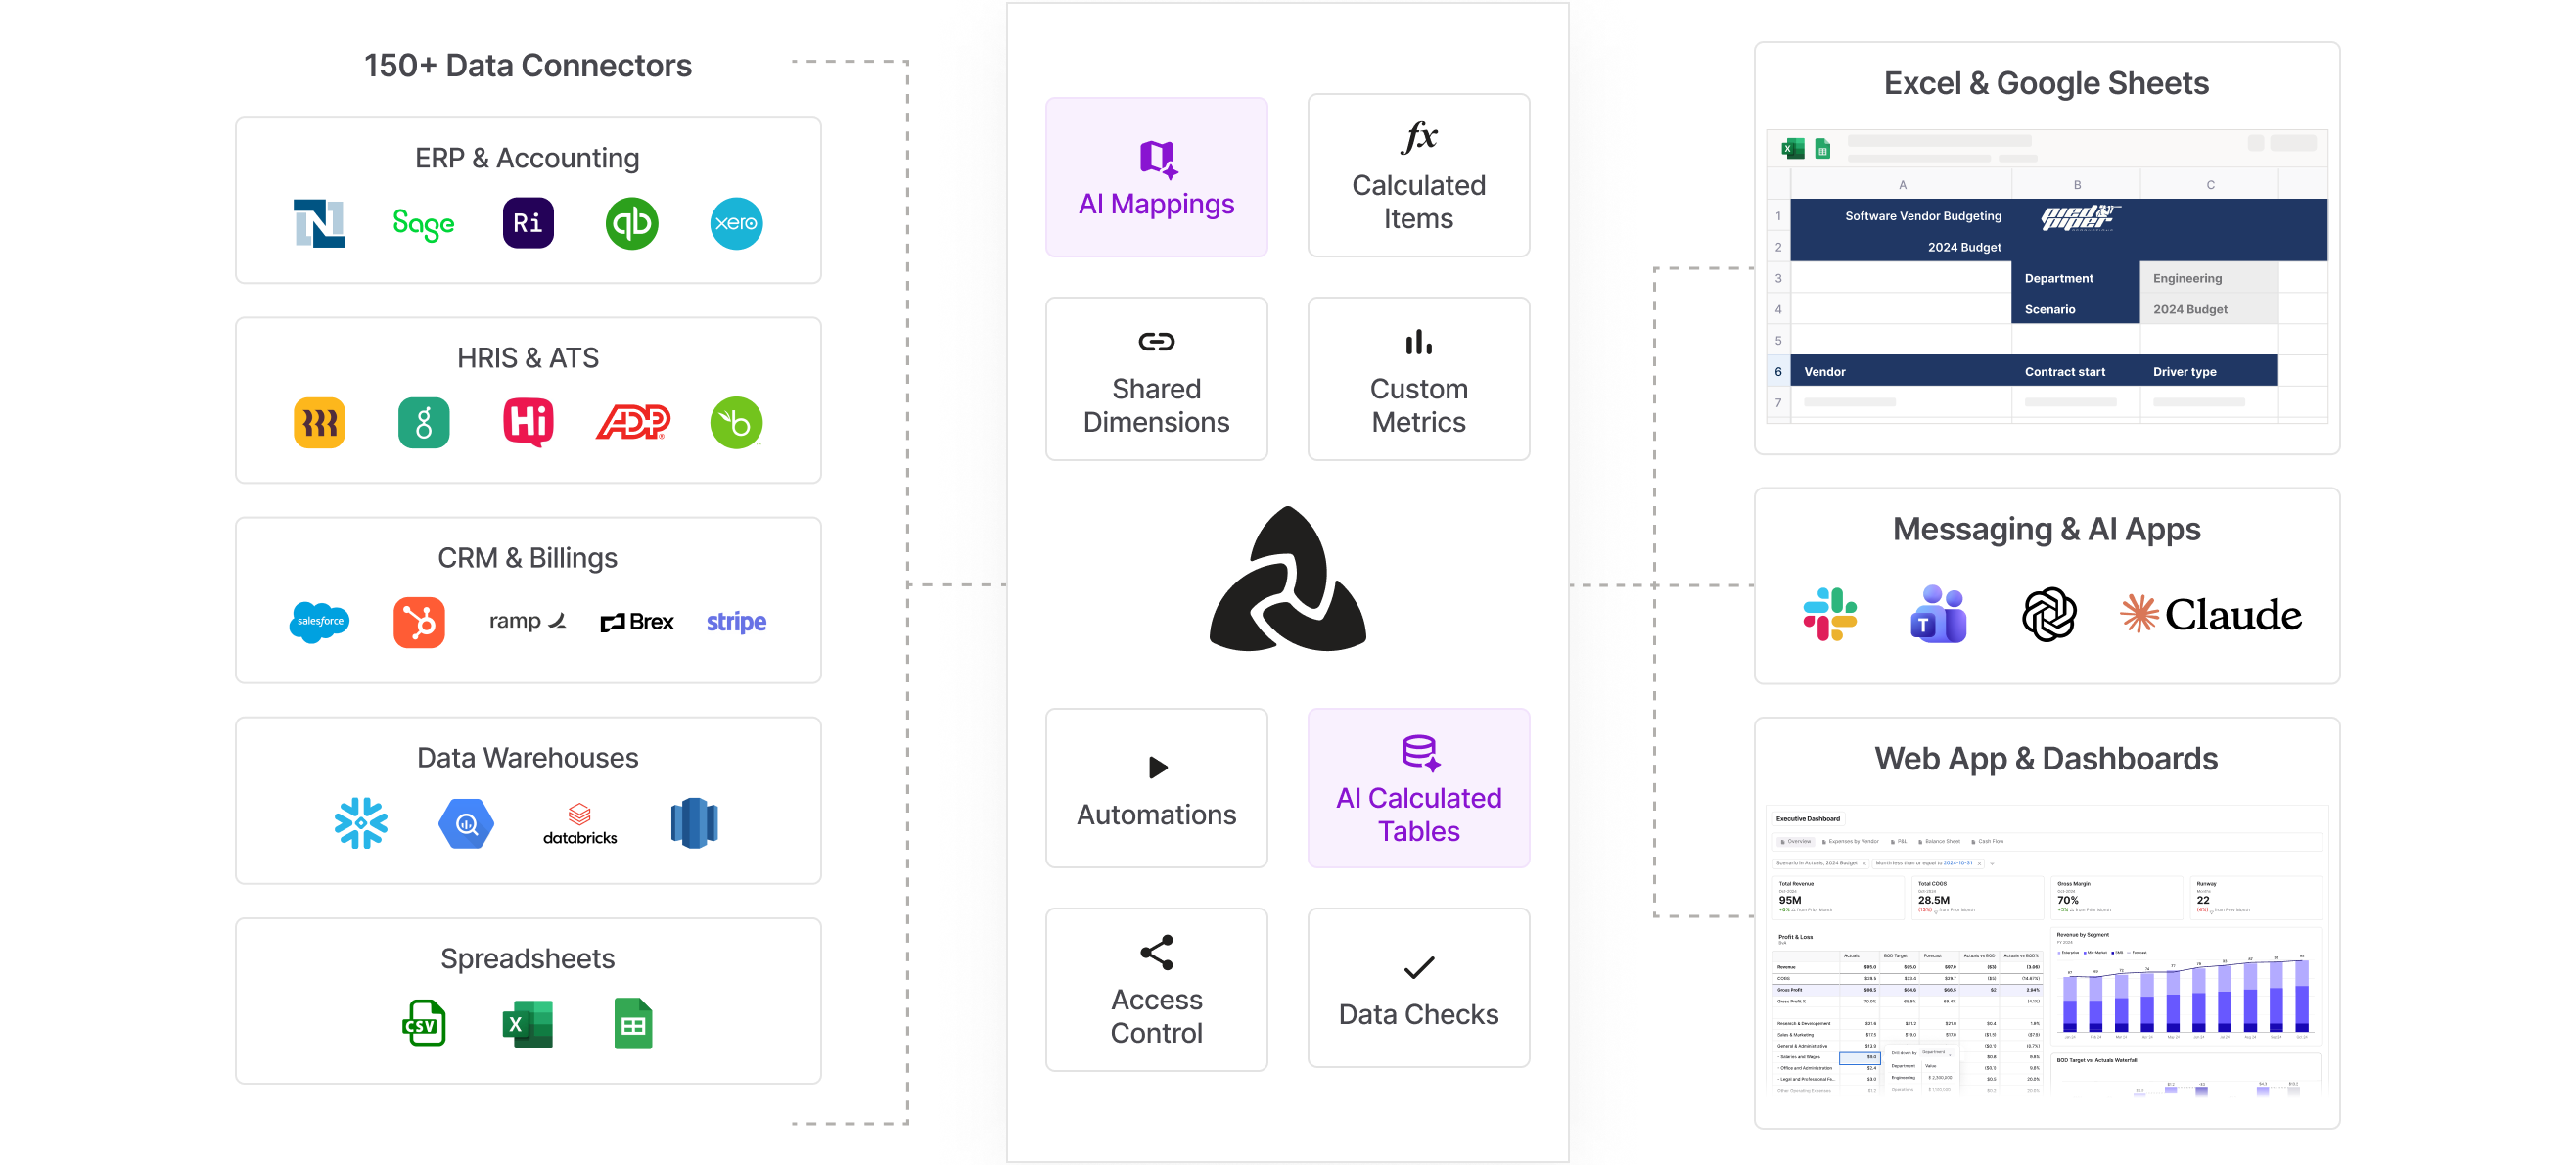
Say goodbye to data silos and inefficient processes by plugging finance teams directly into real-time source data—whenever they need it, however they need it structured.

  • 150+ no-code data connectors that keep your data in sync
  • Pre-built data models build structure tables that power faster reporting and deeper analysis
Diagram showing three tables: Budget table with columns Account, Year, Value; Actuals table with columns Account, Year, Value; BvA table combining Budget and Actuals with columns Account, Year, Value, Scenario. A highlighted text prompts creating a BvA table using Budget and NetSuite data for actuals.
Dotted grid

Blend and build custom tables

Building a source of truth means much more than a rigid repository of source data. World-class FP&A teams demand dynamic data built around their processes.

  • Calculated tables build new tables using logic from within or across any existing table
  • Shared dimensions provide the flexibility to share columns between tables
Spreadsheet interface showing vendor budgeting for 2024 with department and scenario details, alongside Aleph app menu for budget data actions.
Dotted grid

Turn spreadsheets into centralized data tables

Turn any Excel file or Google Sheet into a centralized data table for team collaboration or use in other reports, models, and dashboards.

  • Sync budgets, scenarios, assumptions, or any dataset
  • Pull and push entire spreadsheets or selective cells
  • Version control tracks and backs up every change
Diagram of NetSuite Profit & Loss data being split into three views: Audit view, Exec view, and FP&A view.
Dotted grid

Map and match any format

Roll up or rename any columns within a table, providing unmatched flexibility in how data can be grouped, named, and displayed.

  • Clean up messy ERP data without worrying about journal entries
  • Provide different lenses for segmenting departments, vendors, etc.
  • Build custom views for different standards and stakeholders
Interface showing a data check for missing vendor names with a filter for empty vendor names, and a Slack notification reporting 24 failed records.
Dotted grid

Automatically check for data discrepancies

Keep your data squeaky clean with Checks, a no-code monitoring tool for flagging data discrepancies and abnormalities as they arise.

  • Configure rules that automatically run in the background
  • Get notified whenever a Check fails
  • Install our Slack app to get alerts directly in Slack

"Aleph quickly gave us the platform we always wanted without pulling data scientists and engineers from other projects. Aleph has already done the hard work for us, and it works great.”

Ryan Freudenburg,
Director of FP&A
Young man with short light brown hair wearing a red button-up shirt smiling outdoors with green blurred background.

Discover Aleph today

Contact us and learn how Aleph can help you build your one source of truth for financial data
G2 badge for software that is the easiest to administrate
G2 badge for software that is a grid leader in their category
G2 badge for software delivering the best results
G2 badge for software users are most likely to recommend
Screenshot of an income statement spreadsheet comparing revenue, cost of revenue, and operating expenses for Jan 25 and Feb 25, alongside a sidebar menu with options including 'Income Statement,' 'Analyze with AI,' and other budget categories.
Dotted grid