Vibe Coding in Finance
Join Albert Gozzi as he uses AI to build working finance apps that solve problems submitted by the audience. He'll demo how modern finance teams can move from vague questions to working artifacts in minutes without writing a single line of code.

Inside the journey
Most finance teams have embraced AI, but many are stuck in the experimentation stage. Few are actually building tools that add value in their day-to-day.
In this live session, Albert Gozzi shows how finance leaders can "vibe code" their own apps in minutes. Without a script to rely on, he'll have to create tools that solve problems submitted by the audience in real time.
You'll walk away with a framework for building your own finance apps using natural language, judgment, and iteration.
Join the session to learn:
- How to turn common finance questions into working tools using AI
- How to build financial artifacts without traditional coding
- Why judgment and finance context matter more than syntax
- How to iterate, debug, and improve outputs in real time
- Real examples of finance tasks automated live during the session
- How modern finance teams think about AI as a “build layer,” not a chatbot
Plus live Q&A and access to the prompts and workflows used during the session.
Watch the webinar
Watch Albert Gozzi build real finance tools live using AI. See how modern finance teams move from vague ideas to functional artifacts faster without engineering support.
Chapters
- 00:00 · Introductions, vibe coding and agenda
- 06:58 · Things I've vibe coded recently
- 11:05 · Three levels of what to vibe code
- 15:55 · Where to vibe code: Claude, Replit, Cursor
- 17:49 · Level one build: forecast anomaly detector
- 35:10 · Level two build: stock option calculator
- 44:20 · Level three: when to buy, with Aleph demo
- 55:20 · Q&A: dashboards, auditing and LLMs
Read the transcript
00:01 All right, welcome everybody to this VIVE Coding Finance webinar. We're gonna give people thirty seconds to a minute to join before we get started. Jamie, this session is going to be recorded. We'll share the link with everyone that signed up via email. So, I hope that you stay with us, but the session is gonna be recorded. As we wait for some people to trickle in, if you wanna comment in the chat, where are you calling in, where are you dialing in from? We'd love some interactivity. Good afternoon, Daniel. Thanks for commenting there. All right. Okay. We're gonna get started, but yeah, please keep interactive, comment in the chat, ask questions. I'm gonna be keeping an eye on the chat. I'm gonna be also, our marketing team is behind the scenes, making this possible. And they're also gonna be checking the chat and answering. So yeah, without further ado, let's get started. First of all, who am I?
01:13 I'm Albert, co founder and CEO of Aleph. Aleph is an AA native FP and A company. Before starting Aleph, I started my career in finance at Procter and Gamble. I was a consultant at Bain. And then I went to business school here in the US and started Aleph. As a consultant, I did a lot of presentations. I did some estimates with HTTP slash cursor, and I think I put the number at seven forty two. But the more interesting stat for this conversation is how many presentations were success depends on an LLM behaving consistently. That number up until today was zero. And now it's gonna be one after today. So bear with me, this is very vulnerable and a lot of things can go wrong, but hopefully it will just make it more fun if anything. One disclaimer before we go into agenda and how the structure of the world is gonna be. If you came here because of these LinkedIn posts, one of the things that you would see there is the no slides, no theory, just hands on finance and AI.
02:32 Our marketing team went wrong and over promised. I never said I was gonna do no slides. As a proper consultant, I do not endorse this post. As a proper consultant, I think I love my good slides. I think they're pretty helpful in setting the tone and framework. But I do promise that it's gonna be only a few slides and then we're gonna go and actually bytecode. But I'm saying bytecode, I use this term maybe like five, ten times in the conversation already. Some of you might not even know what byte coding is. So what is byte coding? When you think about where byte coding comes from, it can only be traced back to this tweet from Andre Carpathi. Andre was a co founder at OpenAI, left a long time ago, but still being very involved in the tech community and the AI community. And here he's describing how this idea of vibe coding, at least roughly this idea of you're describing what you want in plain English. The AI writes the code for you. And then you iterate, you review, you keep sending messages, you keep prompting, but you never touch the code.
03:44 And I think that's in essence what vibe coding is. And I'm gonna try to show you what this could mean for finance as opposed to engineers. That is where this originally started. As you can see, and this was one year ago, February twenty five, things have only getting better over the last year. So if it already felt magical and felt interesting one year ago, I think it's only even more impressive today. All right, so what we'll cover today, what the agenda is gonna be. First of all, my framework for what you can vibe code. I don't think everything should be Vibe coded. There's a lot of things that you should definitely not Vibe code, and I will talk about that as well. The second one is where to Vibe code, where are the tools that I use, where the tools that you might wanna use in the future. Third and the most important part of the session, what our marketing team promised will happen and we will build some things together. We will vibe code together. And then finally, we're gonna do a very small section on how this ties to Aleph.
04:56 I don't want you to think that I catfished you into joining this webinar, promising you nothing about Aleph. And now I'm gonna sell you a timeshare, and I'm gonna try to stick Aleph in the conversation. So it's gonna be very small. It's gonna be towards the end. If you wanna leave and only listen the first part, I won't be offended, but that's gonna be how we're gonna end. Before you go into my framework, I wanted to thank you all. There's a few hundred of you in the audience. We got one hundred and fifty ideas submitted as part of the webinar form. I think many, if not all of the things I'm gonna show you today came from your ideas. So first of all, thank you for making my job easier when putting through this webinar. Just to give you a glimpse of what people have actually been suggesting and recommending, I put together this image, this workload, you can see some of the common themes, but truth be told, I do think workouts are terrible. I don't know how to read this. I don't how you take any insight out of this. So what I did is actually put this over into a few categories that made sense, at least for me.
06:12 And these are some of those categories. So forecasting and planning, bias and adaptation, unit economics, reporting. I'm gonna try and do a few things depending on how LMs work. It might go better or worse. I'm gonna try and cover a little bit of many of this. Those are some of examples of the actual things that you all suggested. There's gonna be many that I won't get to cover. Maybe they are too complex to write code. Maybe we're in a round of time. So towards the end, as we do questions, I'm also gonna take your questions on, I wanna do this, how you would think about why coding this. And I can give you my approach and a more conceptual answer to those things that I'm not gonna be able to get to. Before we go into framework, one last thing, and then I would promise I will go into the framework. I wanted to give you a sense of things that I have bytecoded recently, and recently is in the last month or two. I probably bytecode, the team will know and tell you, I bytecode something every week, if not every day.
07:23 So just to set you the right frame of mind and get your ideas flowing, these are some real things I have done. One is an AI cost tracker. We didn't start as an AI tool and AI became more of a core part of the product today. It's going well, which means that our AI costs are going out of control. So I have a small app that I built where I just live coded a cost tracker and I made it easier to track those over time and see what were the things contributing to that. We are growing a lot as a company. We're hiring a lot. We're giving people equity as a venture backed startup. So I have a script that I wrote to an agent that like combines Rippling and Carta, finds out who's missing a grant and creates a CSP that I send to the lawyers for them to go and execute. We're iterating along our go to market. Our pricing is changing. It's only going up. So if you're at the same time evaluating Aleph, this is a good moment to become a customer. But I do a lot of process and thinking of, okay, what's our pricing model?
08:33 What can we change? How can we make it better? And I have done both a lot of analysis around that and also around ACVs, contract value, how our deal sizes are looking and what predicts differences there. I did a head count planner similar to equity. How can we visualize more the plan through twenty six? And finally, one of the things that I actually did that I think was really interesting was this presentation. That's certainly much more advanced than some of the other things that I would cover, but I think it's very interesting nonetheless. I did this with cursor. I will cover later what cursor is, but just to give you a sense for it, this is what the setup looks like. The presentation is actually here and I could either type or I could even use voice and say something like, can you cursor, can you add like the timing, the time that I took to VIVE code all of these apps? The cost tracker took me fifteen minutes, the equity reconciliation one hour, the pricing model analyzer twenty minutes, and all the rest are in the presentation to be ten minutes.
09:51 This presentation took me actually three hours. So I'm gonna pause and I'm gonna send that. And then I'm gonna let, cursor in this case, the AI do a little bit of its magic and see what it does. This started to get into the live by coding. You don't know what's gonna happen. A disclaimer here is that voice sounds for a lot of fun. I honestly would never use it with voice. I would probably in most cases just type. It's very rare that I actually would use voice for something like this. But as we're here, I can come back and I can show you, we can go back to presentation. Here you see the presentation updating live and they actually adding this timing for each of those. So I think did pretty good job. I don't know if I would have much feedback. I would maybe go and align. You see it like these are not aligned vertically. I would give it some feedback and keep tweaking, but I think it's pretty good demonstration of how this can actually work. So I jumped a lot further ahead. That's very advanced.
11:05 How do I actually think about what do I go, what to not, what to use? For me, it's less about the topic and it's much more about how deep you wanna go in the actual topic. So level one for me is things I think I can one shot. Shot is a term that engineers use a lot of, I wanna open a chat, write something, and I'm expecting the AI to be pretty good at achieving the goal only in one message without like much iteration. Reality is that it's rarely one iteration. So there's a bit of back and forth, but I start here saying, okay, I think I'm gonna be able to do it in very close to one message. What does that share? It shares things like, okay, I need a lot of data. I might just paste it into a chat. Directionally right is good enough. Maybe I need a lot of precision. I'm not expecting to use these a lot. I'm expecting more of like to use it once and throw it away. My mental model is this idea of like a napkin math, like something that I'm just, I want to scratch paper.
12:14 I want to take a few notes, help think about this and then move on. The next step is, okay, now I want something more than that. And there's many things that might take me to think about these as like a level two and treat it differently. It could be that there's more data. There's too much data to just copy paste in storage. I need to trust these more, like directionally it's not good enough. I might wanna reuse it and I wanna automate some process. And I also need to be verifiable. So an example of this is this equity reconciliation that I told you, even this presentation, I want to keep making tweaks. I want to be able to adjust it myself. I'm not going to just do that one shot. And then the third one is this idea of more production level system. Here I need things like I need live feeds from systems. I need to be auditable. I need to be always running, be defensible. In the next few years, hopefully Aleph will become a public company.
13:22 I wouldn't buy code our S1 filings. I would probably use this level three I would use for a different type of systems for this. Know there's some of the questions that are coming up. So let me answer a few questions before I move on. So I think Shruti was asking like, can we do a live coding chat GPT? This is gonna be what I cover next, some of the different tools and where to do it. Scott, for live coding this precision cursor, Yes, this is actually all cursor and it's being shared via cursor. I can download it as a PDF, but this is all cursor for now. And then Karen was asking about infosec side of things, confidential information. That's gonna be a big disclaimer later on. You should check with your internal company policy. You should check with your agreement with OpenAI, Cloth, Lavable, whatever you say you're using is, and make sure that you're doing this within the constraints of what's actually secure in the context of the data that you're sharing.
14:37 But people are already mentioning in the chat certain tools. So before we go into tools, I want to say that this idea of the levels, I think it's a good framework for me mentally, but it's not necessarily meaning that each idea will squarely fall into one of them. When I think about that, I think about even the same idea, depending how far you wanna take it, can have different levels. For example, a variance analysis, there's something very simple that you can do around just pasting a few columns and seeing the differences. One level up, you can just start to correlate with different drivers, understand what's moving, maybe put more data sources, like more granular data into it. Level three would be, okay, it's generating directly from my QuickBooks, NetSuite, Oracle, and it's happening automatically in Mountain. For forecasting, we can do some like trend lines. We can go from that into a multi driver model, and then we can connect to Salesforce, HubSpot, make it ready for the board and so on and so forth. I'm gonna show you a few examples. I can talk as I go, I'm happy to answer questions as well. But I think this idea of things won't fall squarely into each category, I think it's important to have in mind.
15:55 So where to whiteboard? There have been a few questions around this in the chat. Some of you might be more familiar with some of these tools. Some of you might be less so. So the way that I think about this, there's, first of all, I'm not a tools maximalist. I think the power here is mostly in the underlying models, the OpenAI models, Syntropic models working pretty well. That makes it so that any tool will work to a certain extent. And it's more about trying what works for you and what you prefer more than thinking that there's an absolute truth. But I would probably bucket things into three. I think the first one is just pure cloth ChatGPT, very zero setup. You don't need a lot. You can get pretty far, probably further than you think if you haven't been exploring these in-depth with just those. The second one is if you wanna go one level up, I think someone was mentioning Lovable in the chat. I'm going to use Replit for some things today. I think it's interesting, like you can have a database, you can store data, you can make it more visual, more iteration.
17:06 If you want to share something with the rest of your company, I think it's gonna be something that these tools will give you the power. And then the third alternative would be going all the way to cursor, which is what I was showing you, or something like plot code. This is different level, full code base. This is what engineers use. Our engineers at Aleph use these tools every day to build a product that we put out there in the market. So some of you might venture into this, but part of the message is that you can get pretty far with just the two and you can even further than you think with JustGLOD or ChatGPT. With that, I think it's time to start building some things. And of course, first disclaimer is things might break. It's part of the fun. It's part of what I sign up for when the marketing team has this terrifying idea. Also, another disclaimer is, I know there's a wide range of experience in this room. Here we have people commenting that Clubcard is amazing. We might have some people that haven't even tested the limits of what chattypd or Clubcard can do. So I'm gonna try and cater for everyone.
18:23 And I'm gonna try to show some of the more advanced tricks while trying to make these beginner friendly and explain things from the ground up. But please drop a note in the chat if you think this is too fast, too slow. I'm happy to, I'm gonna keep an eye. Our marketing team is also keeping an eye on the chat and they might interrupt me if I'm moving along too fast. I would love for you all to leave today feeling that you can replicate some of what I'm doing in your own workflows. All right, so level one, let's start with level one. The way this is going work is I'm going go and I'm to try and build some things from scratch. I do have some gloves already there that I can show what the things might look like if it happens to fail for any reason or if it starts to get too complicated. But for the first one, I wanted to talk about this anomaly detector because I think something that many people brought up was one of the higher rank answers in the chat. So I'm gonna build a V1 of this. So in order to build a V1 of those, I'm gonna start with a financial model. This financial model is a dummy financial model.
19:38 It's one of our templates. It's a simplified version of our templates. This is a full three statement model. As you can see, P and L, balance sheet, cash flow based on a lot of detail around revenue, headcount, it gets really sophisticated. For the purposes of this duration, what I'm going to say is I have my model, I have my P and L, and I just want to make sure before I present these to the board, CEO, whoever you want to call it, I want to make sure that I didn't have any errors. So one of the things that before I jump into MLMs, one of my biggest stakes here is that trends are much easier to spot when they are visualized. So it's very hard just quickly scanning these and saying, okay, the *** people is too high or it doesn't make sense. It's very easy to do once you visualize it. I want to give this to an LLM to visualize it, but this is a very complex model. So this is where you need to start developing some of the intuition. And my intuition would tell me, okay, you know what, it's actually going to be better if instead of sharing everything, I'm only going to share the output and I'm going to paste it values because I care about the numbers, I don't care about the formulas.
20:51 So I will start, I don't know, like I'm hiding some of the columns. What I'm doing here is I'm trying to make these, like I'm trying to make the LLMs and set them up for success as much as I can. So I'm gonna have something like this, which is a simple P and L without many extra columns. And I'm gonna go and say, I don't care about anything else. And I can call these my output. Once I'm there, I'm gonna go and when I open Clot and I'm gonna attach this file to piano output. And I'm gonna describe what I want. And there's a lot of importance here is the, it's the ideas are the thing that matter the most and taking one second ahead of time, thinking what you actually want to achieve dramatically increases the odds of these working well. So what I'm gonna say is, would like to create an artifact. This is the first code that is important.
22:01 You're gonna see and you're gonna realize what this means. It's basically I want Cloth to not just reply to me. I wanna create something interactive that is gonna open here on the right. And I'm gonna say to validate whether these, my forecast makes sense, I would like to be able to have a dropdown to select a metric, a row in the spreadsheet and visualize it to spot trends or anomalies. So I could make these much better. I'm gonna try and start with as simple as I can. And I think that's probably another important comment here is the more you wanna do a lot of things at once with LLMs, think about every decision that the LLM makes. Today, LLMs are pretty good and they have a ninety five to ninety nine percent chance of making one decision correctly. If you ask for one decision, the odds that this is going to work are very good.
23:14 If you ask for them to make a hundred decisions before checking in with you and giving you guidance, those of you that are probability nerds understand that that will severely lower the offset this is gonna work correctly. So I think like building iteratively is probably another important tip here. While this takes a little of time and it's building some of these artifacts, I wanna see if there's any other questions in the chat. James is asking how much of Aleph itself is five coded? I would say, no, probably close to zero. I wouldn't recommend related to some of the questions around production grade security. I think you can use five coding to guide you towards the answer. You can build prototypes, but I think it's important when you go into production level systems to compliment that with people that know what they're doing, people that can see the code that is generated and can make sure works for sure.
24:25 Yannick is asking, how would you embed automation tools such as an ADN or would you rather skip them and jump to Cloud Code? I don't think there's a good, like I think the answer is you should do whatever is more comfortable for you. I think Cloth code, I would think about it as it's like the most low level that it can be. It gives you a lot of power, but it's also harder to understand. It's harder to find errors and find mistakes. So I think there's a lot of tools where I am very comfortable using plot code. If I don't think that I need all that power, I will always prefer a simpler tool that I know has less room for error to a more complex tool that it's more likely to hallucinate. Any extra questions? If not, I can I will probably start something in parallel just to give you a few? So one of things I wanna do is, at least I'm doing more internal and validating whether things work.
25:31 I'm gonna do one more of those That is in here, I also have two datasets that are pure downloads from Salesforce around accounts and opportunities. I'm gonna replicate one of the things that I say had done that also people were asking and thought were interesting, that is doing the ACV contract size analyzer. So I'm gonna repeat the same. I'm gonna say, okay, Salesforce accounts and opportunities. Can you build a contract value analyzer? Sorry, artifact key here to really point Cloth towards anything artifact for me. I want to have filters, have drop downs where I can select different regions, industries, quarters, or anything else you feel relevant. Display a histogram showing contract values for that subset.
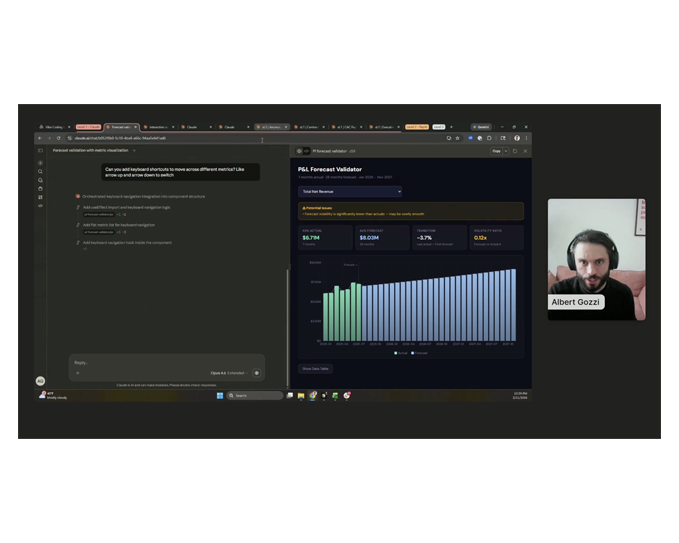
26:42 And then let me adjust the, like when you do histograms, how much you cluster things matters quite a bit. Let me adjust the size of the groups in the histogram. And those are things that again, might not think intuitively, but once you start iterating enough, you will already pre think that some of those are gonna be helpful and you will cut iterations. But again, there's a lot of this fine margin between the more you can do, the more you ask ahead of time, the more likely it is for this to be run. All right, so now you can see we have our first artifact. We have our first forecast validator. And one of the things that I can do is I can select any metric. So for example, *** software, and I can see what's going on. And here you can see, I'm really starting to get some insights that I couldn't have gotten from just the financial model. It seems like the ***, it had a jump here. You can see it went from ninety four to two fifty, and then it continues at that rate. It became much more obvious here. My main intuition, I always like to take things a little bit the next level.
27:53 It's okay, wanna do all of these, but this takes, will take me a lot of time. I need to click and go and click. So I would do things like, can you add keyboard shortcuts to move across different metrics like arrow up and arrow down to switch. And this represents my real workflow where I would actually be doing a few of them at the same time. And I would probably in most cases be multitasking, either doing this while I do emails or doing multiple of this analysis at the same time. And here you can see it's working. So when it works, I'm gonna show you some of the things that I had done. This is something similar to the one that we did, but with more sophistication. Here we have one that is the same data. This is the same data that I was showing you over here. But what I actually did is I asked you to do purely a dashboard and a presentation. So this is just showing this the way that you would show it to an executive and combining some charts and presentations with even some key trends and insights.
29:12 I like this. I wouldn't trust it as much. I think like the best application of something like this for me would fall into that level three, where I would actually want like something that is purpose filled for this. Okay, so now we should be able to have shortcuts. So now you see, I can actually scroll through everything and be much faster in analyzing. And I see, okay, you probably should, I would take notes and give it back to the finance team and be like, all right, we should probably increase revenue stream one. This forecast makes no sense. The same with revenue stream two. This looks okay. And so on. As you can see, there's things, it moves around. There's other things that if it's were proper software, I would do differently. But you see how fast I got to something like this. When I give this a minute and if not, idea is wanting to show you a few examples, wanting to show you the art of what was possible, but I wanna make sure I have time to show you some of the more advanced versions as well.
30:19 So we won't wait for it too long. I'm gonna take questions. Any word error rate metrics that I see as relevant to keep track of or to measure ROI? That's a great question. And I think honestly, it's hard. The way I think about these and when I think for example, about what we spend in our LLMs cost and everyone on the left has a cloud subscription and a chat GPT subscription and Reddit subscription, I just think that there's so much about these, that is experimentation that you kind of need to accept these as, part of this might have a clear ROI, but part of it, you're just investing in, the team in learning, in getting better and to be able to maybe unlock something in the future. I think that the ROI is never gonna be like linear. And Kevin, Alice, a few people were asking about the artifact. So if you look at Clove, the artifact is this side panel. This is the way that just Claude calls it. So if you see here, you can see even a list of artifacts and you can start from there. So if you ask something else, you might still get an artifact.
31:45 But given that I know that I want that level of interactivity and that's what I'm looking for, it's just like using in the prompt and even like things like capitalizing will make it more likely for them to use that. All right, this might take a little bit more time so I can, like a good cooking show. Oh, okay. So it's there. I was gonna say that I was gonna put it in the oven and take out the baked version, but sounds that we don't need to do that. So here you can see a lot of this napkin math idea. I think it makes a lot of sense of actually wanna see, I wanna explore the data. These are buckets of ten ks, maybe I wanna bucket it more to see better trends. This is a lot of what I would use. I wouldn't use these as my weekly reporting process, but I think it's very helpful as I'm asking myself questions and I have a lot of one off analysis. All right, that's some of the examples of level one. I wanna move on. I wanna make sure that I can cover extra cases. Going back to some of the levels and what I was talking about, a lot of what this shared is there's very little data that is coming in here.
33:03 You can see I'm not expecting to do this recurringly. The whole process of getting here was a little bit hard coded. I had delete a bunch of files from my model. So I think there's a lot of limitations, but it's still a very powerful tool and it's very, very accessible. So I think Rachel and Giancarlo were asking a lot of things around, on the one hand, can you share this with people? And the answer is yes, you can. You can actually publish this and it becomes a link that you can share with people. Giancarlo was asking, can you integrate them directly in your model? Those are the things that you technically could, but there's a lot of effort involved, at least today in going there. If you want to do something like that, that's where specialized apps, I know one called Aleph, and there's many, that's where I would go into more of the realm of, you might want to get a proper SaaS in order to have like a fully connected end to end process. That's a read on level one. Any, I'm gonna take a look at the chat and see if there's any other extra questions before we, before I move on.
34:19 Oscar is asking, who holds the IP of the vibe code you have created? Could you market, offer a subscription, or have created third parties? Very interesting question. I don't feel qualified to answer and I wouldn't wanna provide legal advice, but I think there's versions of it, know, without giving legal advice. When you start to go more into this level two, I think there's version of it that could be more of a service and start to get more into the, it could be something that you can offer as a product. All right, so that's it for level one. Again, there's a lot of depth. The way that I show you the shortcuts here, I would probably keep tinkering and improving this another twenty, thirty minutes in order to get to something that I feel is enough. But I'm showing you bit of the how to get started and how to think about it. For level two, we're actually gonna do is one that was, a bit more complex. I think it starts to go into this idea of I want it to be more shareable and it's interesting. And actually a few of you submitted this.
35:29 It's like a grant calculator. It's something that we do ourselves at Aleph for every offer that we do and the finance team owns it. Where we start from is we have this stock option calculator and like B1 of what we did at Aleph was very, very similar to this. All the numbers are dummy of course, but it was, here's your offer. Here's your offer. Here's what it might be valued at in some scenarios. And this is a fictitious company that is like series A. So what I wanna do is I wanna go from these to something that is a bit more exciting, but I don't wanna do it as a napkin math. I want to do it as something that I can actually make part of my process. So what I'm going use for this is I'm going to use Replit. I'm going to open a file and I'm going to same star from my Excel file. You see very similar trend with what I was doing with Cloud. And is, can you build and this one, I would spend a little bit more time the prompt. Can you build a stock option, total comp calculator that mimics the Excel I attached?
36:41 It should take as inputs the detail, the offer details. It should know data about the company and it should output different valuation and total comp numbers depending on different outcomes. I personally didn't want to this from a copy pasted prompt. I would probably, if I weren't doing this live with a few hundred people looking at me, I think I can do a better prompt than this. But part of the idea is trying to show you that even without the perfect prompt, this will start to be interesting. So I'm gonna answer a few questions, a few more questions while this goes. So Rachel, when you take it live, how's the data continuously updated? Do you have to go back to Cloud to add new data? The answer is yes. In some of the level one options I shared, you will need to just drop the Excel file again. That's the part where it becomes a bit more manual. And I would think about, okay, I will actually, if you want to make it more repeatable, there might be better versions.
37:58 Using something like Replift might be one of those, where for Replift, you could start building more complicated things like I want to have a file upload button and I want to have that take an Excel file. Every time I update, I take an Excel file, I want it to create a new version for me. Those are things that you can get to with some of these tools. Data will be a little bit harder to do without. See the chat, any more question? Yeah, Oliver was asking, is there any reason why you use Replit versus Lovable? I think you heard this earlier, all of them work pretty well. Honestly, I think I started using Replic quite a while ago and I'm more familiar with the UI, but I think it's whatever you feel more comfortable in. I think I will optimize for your comfort and your user experience that speaks more to you rather than always be chasing, okay, Replit might be two percent better than lovable, therefore I'm gonna switch and now I'm gonna learn a new tool from scratch.
39:14 Chris has a great question around what differentiates Alephor tools from live quality tools. I'm gonna talk more about that later on, So stay tuned, and I'm gonna talk about it in probably like five minutes as we move on from this. All right, we'll give it more time. If it doesn't output anything in the next minute, I will probably just like move on or like leave it running and then come back after. Let's see if you have any more question while this waits. I'm gonna actually show you, I did this in the past because I knew this one would take a little bit longer. I can show you some of what the prompt looks like. You can see that I did probably four or five messages in order to get here. I can even share the entire conversation if anyone wants to email me and ask for it. But as you can see, what this does is I input my offer, her salary, number of options, strike price, and vesting period.
40:28 And I have some of the company info that I could edit in, if I were to share this properly, I would say, don't make company info editable and things like that. But what I can see is in different output scenarios, I can share these with people and they can know what their total comp per year, sorry, total comp for the four years might look like. And this is something that I spend five minutes in. So it's like a few prompts across twenty minutes. And you can even ask you have an offer from someone, I can even copy shared link. And this will share a link with this pre field for someone. If I enter incognito, I even very, very easily put a password in it. The password that AI generated was Aleph forever. I didn't choose that. And then you can see your actual offer. So I'm gonna even put in the chat if anyone wants to play with it.
41:37 Again, password is Aleph forever. This is something that I built in five minutes. If you wanna do something like this, I would probably say one hour, you can get something very, very solid, just nudging the LLM. And you can see that this is even, we have the version that we started, which I would honestly may even like better than the one that I had before, where it's like easier to use and a little bit simpler. All right. So that's just such a simple example that goes into some things that are more interesting, like IID a password. This is something that you could roll out to the entire company if you wish so. And of course, you need to be mindful of some of the limitations around security and some of the questions that we were discussing earlier. So some of the learnings from number one and two, I think the main one is this idea of the bottleneck is no longer a technical skill.
42:43 Anyone regardless of technical skill can get pretty far and the right idea is what matters most. What's second to that is understanding feasibility. You can see that as I was talking about, I had a lot of intuition of, okay, this one I would like to add it at the beginning of the prompt. This one I will wait, I will see what the LLM does and then do it. There's a lot of that that comes with learning. But I think one of the, and you will only get better at both of those by practicing. But my only encouragement is that the limit is higher than you think and more things are feasible if you do them step by step than you would think. And I think that the more encouraging part here is the idea of, you can just do things. And I think it's a very exciting time to be a knowledge worker and have all of these tools at our disposal. Things that might take a week of an analyst sometimes if you have the right idea and you approach it the right way, you can do them in like half an hour, one hour. So yeah, it's just like I'm at heart a techno optimist. I think it's just a very exciting time to be working on these type of problems and having all of these at our disposals. And we're early.
43:59 I think it's the, we'll tell our grandkids that we're live coding things when OZ started. So I think that's pretty powerful and interesting. And of course, the disclaimer, keep security in mind, don't pay sensitive data, have your engine, your IT team validate some of these things that you wipe code before going to production. We have fifteen minutes left. When we talk about live coding level three, this is going back, Chris, to your question around what's different between Aleph and a full suite of byte coded tools. I think for me it's the idea of you could byte code your way into production. You could say, I'm gonna, let's take aside the left for a minute. You could say, I'm gonna take out Salesforce. I'm gonna save that money and I'm gonna buy the code a CRM. You can do it. Do you want to do it? It's the real question. And the way I think about this is you're choosing between I as a finance person or I as a DevOps person, I'm by coding and maintaining my own app, or I'm working with a vendor where the ones that are vibe coding or not vibe coding, the ones that are using AI to ship faster are my vendors' engineers.
45:20 Who would you want to trust to build your architecture on top? And I think like that's really the thing. And again, it takes a lot of choosing the right vendors to partner with that understand and you think are going to be using that. But today, I mean, I'm a finance person at heart. I'm also CEO. Today I do encourage our team to not reinvent the wheel. I think we're buying more software than we would have before AI. And that's because we see the power of this in our own product. And we think that instead of me thinking about a problem, CRM for five hours a week, I want an army of engineers to start thinking about that for a long time. So this biased, but I wanna show you a few minutes on how some of the workflows work within Aleph. And then I'm gonna do questions towards the end. So I'm gonna show you some of the building blocks, some things that are more interesting, more simple, and then I'm gonna go into some of the more exciting forward looking. The first one is variance analysis. Again, CLOUD would be very good at variance analysis, But as I think Rachel was asking in the chat, you will need to copy paste all the time, the numbers and you need to start from scratch.
46:39 So one of the things that you can do, you have a trended view like this, you understand what changed between March and April. You can just have an agent do that for you. And you can say, oh, I You can say, okay, want ten percent, let's do two percent and two ks. Sorry, had this open for a while. All right, let's do a question while I reset this. James was asking, how much time do you spend on Vibe architecting, thinking through a solution before committing to code? I think a decent amount is probably the answer. If I were to do some, and it depends on how it's a level one, it's a level two, the harder it is, the more time I would spend like ahead of time trying to figure it out. So, all right. Let switch for a second. And the results were I wanted to show you this is the same idea.
47:52 It's like a trended view and I wanna figure out the variance and instead of doing it myself, I'm like telling the LLM to go and do it for me. And the LLM is figuring out those variances and it's trying to get to the bottom of it. And as you can see, it takes a few minutes. I can say, okay, if in legal services, your variance comes from one vendor called Lee and Associates. And if you want, you can like double click, you can drill down into this. I wanna see the breakdown by vendor and it will give me that vendor breakdown and I can verify that indeed Lee and Associates is the one doing most of the work. This is good. It's very low level and it's very detailed. That's not the way that you would present it to your CEO or department lead. So you can also use AI to come up with explanations. So let's say I wanted to start these from scratch. I can say, I want to summarize what I have in the chart and I want to have the main variances in terms of vendors or departments. I can start to use a left to again, a different agent that what it's doing is it's grabbing that data from the table and it's summarizing some of the main highlights.
49:10 Again, this is made with like very simple basic prompts just to show you that doesn't take a lot. But here you can see the few vendor driven swings, including these Lee and Associates tab is the one that we looked into. That's very simple. The way that you embed some of that into a workflow starts looking something like this, where now you're doing a various analysis for a department lead. I don't think you should vibe code this. I think like tools out there like Aleph already have a lot of these built in. And you can use AI effectively by having a lot of these low level analysts going understanding, okay, my actuals versus my version of the forecast, there's a gap and it's mainly explained by AWS. And then you're able to highlight that in like a summary, an executive summary, and you're able to go and communicate that in a way that department leaders will understand. So that's some of the AI that is there and these things that Aleph customers are using today.
50:18 But I do think that a lot of these, despite saving a lot of time, doesn't feel quite as magic as some of the things that I showed you and I think the idea of five coding that is more natural language heavy. So I'm going to show you some examples of things that are coming that we're just testing internally. And our engineering team would me to say that this will likely fail, but I think it's cool enough that I wanted to at least give you a glimpse of it. And this is the same dashboard, it's the same functionality. If you look into all of these, those are connected to your data live, are traceable. But here you can see like some sort of that sliver of magic that happens in the clots in the repletes. So I can say, I can start by saying, can you put these two charts side by side instead? And I can start to prompt my way to making these dashboards better. And here I have an agent that has the knowledge of your data, has the knowledge of Aleph that is able to do all of this. So you can see a thinking, this is more of a my internal version that like, you wouldn't see.
51:33 And I can say, okay, yes, let me confirm. Let's start iterating. So I would say, okay, move these. Let's update the dashboard. Perfect. I see the head count chart. It's not that great. Like the decimals are weird. I know why we have so much time. So can you filter the chart for twenty five and correct the labels and access to have no decimals. So here I can see the same way that I'm doing with some of my live coding apps and by coding a dashboard. Unlike by coding apps, this is live connected to your data, will be there next month. You're gonna be able to like roll it forward and keep working with it. This is one of the things that we're working on is making it much faster. So why do things, I'm gonna answer some of the extra questions. So let me go through the chat. So Jeff is asking is user access account provisioning self a tool, something that could be vibe coded? I would say it can be vibe coded for the replies of the world.
52:48 It will be like less common for the for the like plots of the world. Here you see, you got too many filters. So we can say, remove the year filter. All right, so I think like just to not take too much I'm pregnant here. Again, this is pretty cool. This is experimental and okay, we're back. Maybe we can add one thing. Can you add a list of closed opportunities by month from Salesforce as a table. So I can keep iterating. I'm not gonna go too deep in there. All right, I'm gonna see, oh, Walter flagged that I put twenty six instead of twenty five. That's great. Says that he likes the thinking. Appreciate it. Yeah, we're gonna, I think this is like just a little bit too verbose for what I would love to be, but like we're gonna keep the thinking.
54:00 That's honestly some of the people that are early testing this, the fact that they can see the thinking, they might tell us, like Walter pointed out to me, hey, it's wrong because you picked the wrong year. It could tell you a lot of those things. And it can help you steer the model to the right outcome as well. Here you can see, okay, it's creating the chart. It's sending it there. Optimized for token usage? It seems like it's reading information a lot. Where are some of the techniques you have tried to reduce the token usage? I think we're not, like some of what we're doing is more using different levels of models that are more or less expensive as a way to speed things up. But we're not that much focused on optimizing for cost yet. We're really trying to maximize for what's the best experience that can be. I think there's a lot that can be done and there's a lot of proven techniques from other domains to make something that works very just faster or better.
55:20 Okay, Nico was asking, can you import these dashboards to PowerPoint and have them be interactive rather than image based? Can design, I'm answering a few Aleph specific questions. You can import them to PowerPoint. You cannot make them interactive in PowerPoint today. Part of being interactive is you doing them within Aleph and outside Aleph, it will be much more of an image. Kevin, can you publish this dashboard to a non edit, the only audience? Yes, you can share this with any type of audience. There's a lot of permission, like there's a very heavy permission layer that you can work on and we have a lot of like series of templates that you can use. This like VBA template I showed you is one of them. So there's a lot of power in that. Any extra questions? I think there's a few that I have missed, so I will also go back. Akhil was asking, back one second to the comm calculator is how would you audit something like the comm calculator to make sure it works?
56:40 I think for something that is high impact like this, something that it's important for you to work well, I would probably open it side by side with the spreadsheet and I would make sure that it works under some of the assumptions. So I would do something like this and be like, okay, if I'm one hundred forty five, total comp is one hundred fifty two, does it check out versus what I have here? It does, it doesn't. So I would like run a few iterations of that, but I would likely just verify inputs, outputs rather than you could go into the code here in Replith. I would rarely do this. I think like I use this enough that I feel comfortable myself just doing with the inputs and the outputs. Alice was asking, does Aleph use Cloth or a specific LLM? We use a combination of many things. We use like Cloth, OpenAI, Gemini, like sort of Google series, and some like small implementations are ours. So a mix of everything. So left learning to branch out more to EMEA anytime soon.
57:57 We do have a lot of customers in EMEA already. We're a US based company at heart, but we support all regions and we care about all regions equally. Alberto, fellow Alberto is asking, on the left variance analysis, are the variance commentary is shown as dollar in terms of the cost, or does it show impact in terms of gross margin? The answer is it's highly customizable and you can set it up to answer different things depending on what you say you want. All right. I know we have like one minute left. I wanna be respectful of everyone's time. Thank you everyone for coming. We will share the presentation. We will share the slides. Yeah, thank you. Thank you all.