


Get FP&A best practices, research reports, and more delivered to your inbox.
All data in this post is drawn from the 2026 Aleph × Benchmarkit SaaS & AI Performance Benchmarks report, based on data from 342 B2B SaaS and AI-native software companies.
The median B2B SaaS company spends 27% of revenue on R&D, down 8 percentage points from 35% the year prior. That is the largest single-year drop in four years of benchmark data, based on a survey of 342 SaaS and AI-native software companies in the 2026 SaaS & AI benchmarks report from Aleph and BenchmarkIt.
For mid-market CFOs setting next year's plan, the question is no longer whether to bring R&D ratios down; most peers already have. The question is where the cuts come from, which investments still need to be made, and how to think about the AI line item that is rewriting the entire engineering cost model.
The data below breaks down median R&D by ARR band, growth rate, and AI sub-component, with the numbers CFOs need for board prep and 2026 operating plans. For how R&D fits alongside the other metrics that matter, see our guide to the SaaS metrics that matter.
Why did the median R&D ratio drop to 27% in 2025?
{callout} The median SaaS R&D ratio fell from 35% in 2024 to 27% in 2025: an 8 percentage point drop and the largest single-year compression in four years of benchmark data. {/callout}
At 27%, the 2025 median sits 8 percentage points below the 35% figure that anchored 2024 board decks. This is not a rounding error. It reflects a combination of AI-assisted engineering productivity and disciplined headcount management that played out across most of the B2B SaaS market simultaneously.
The spread across the population is wide. The bottom quartile runs at just 10% of revenue spent on R&D, a ratio the report flags as "achievable only through AI-assisted engineering productivity." The top quartile sits at 40%, typically earlier-stage companies still in build-mode, or scaled companies investing aggressively in AI product features.
The single-year compression is worth sitting with. R&D fell 8 percentage points from CY-24 to CY-25, the largest single-year drop in four years of benchmark data. Combined with a simultaneous G&A reduction (24% to 17% over three years) and the first-ever year-over-year decline in S&M spend (37% to 35%), the data confirms that 2025 was the year profitability became the dominant operating objective across B2B SaaS. Rule of 40 jumped 10 points year-over-year to a median of 25%, the largest single-year gain in five years of data. R&D efficiency is one of the largest contributors to that move.

How do you calculate R&D as a percentage of revenue?
{callout} R&D as % of revenue = (Total R&D expense ÷ Total revenue) × 100. The most common error is misclassifying AI infrastructure and DevOps headcount outside the R&D line. {/callout}
R&D expenses under GAAP typically include engineering and product salaries and benefits, contracted development work, R&D-allocated cloud infrastructure, and R&D-specific tooling. Three line items that often get misclassified:
- AI infrastructure (Anthropic, OpenAI, vector DBs, AI-specific compute) belongs in R&D, not G&A.
- DevOps and platform engineering staff supporting products rather than internal IT should sit in R&D.
- Capitalized software development costs live on the balance sheet, not the income statement, and should be excluded from the expensed ratio.
The biggest source of cross-company variance in benchmark comparisons: how aggressively a company capitalizes software development. The 2026 Aleph × Benchmarkit benchmarks assume the fully expensed view. Most modern FP&A platforms surface this formula automatically. See how Aleph handles financial modeling and forecasting for software companies.
How does R&D spend change by ARR band?
{callout} R&D as a percentage of revenue drops from 32% at sub-$5M ARR to 22% at $20M ARR and stays relatively flat from $20M through $100M+. The sharpest drop happens between $5M–$20M and $20M–$50M, making $20M the structural efficiency inflection point. {/callout}
R&D as a percentage of revenue declines from 32% at sub-$5M ARR to 22% at $20M+ ARR. The sharpest single-band drop occurs between $5M–$20M (32%) and $20M–$50M (22%), making $20M ARR the structural efficiency inflection point.
Below $20M, companies are still in build-mode: revenue has not yet scaled to absorb the engineering cost base, and product differentiation requires sustained investment. At $20M and above, revenue growth catches up with R&D investment and operating leverage kicks in. Above $50M, the median stays relatively flat at 22-26%, which is the convergence point where scaled operators land.
The implication for finance leaders sitting between $20M and $50M ARR: your 2026 R&D ratio should reflect the inflection, not the pre-inflection economics. Mid-market boards are increasingly benchmarking R&D against this 22% line, not the all-SaaS median of 27%.
Engineering headcount is the primary driver of R&D ratios at every band. See how mid-market finance teams use Aleph for headcount planning against this benchmark. For a related efficiency benchmark, see ARR per employee.
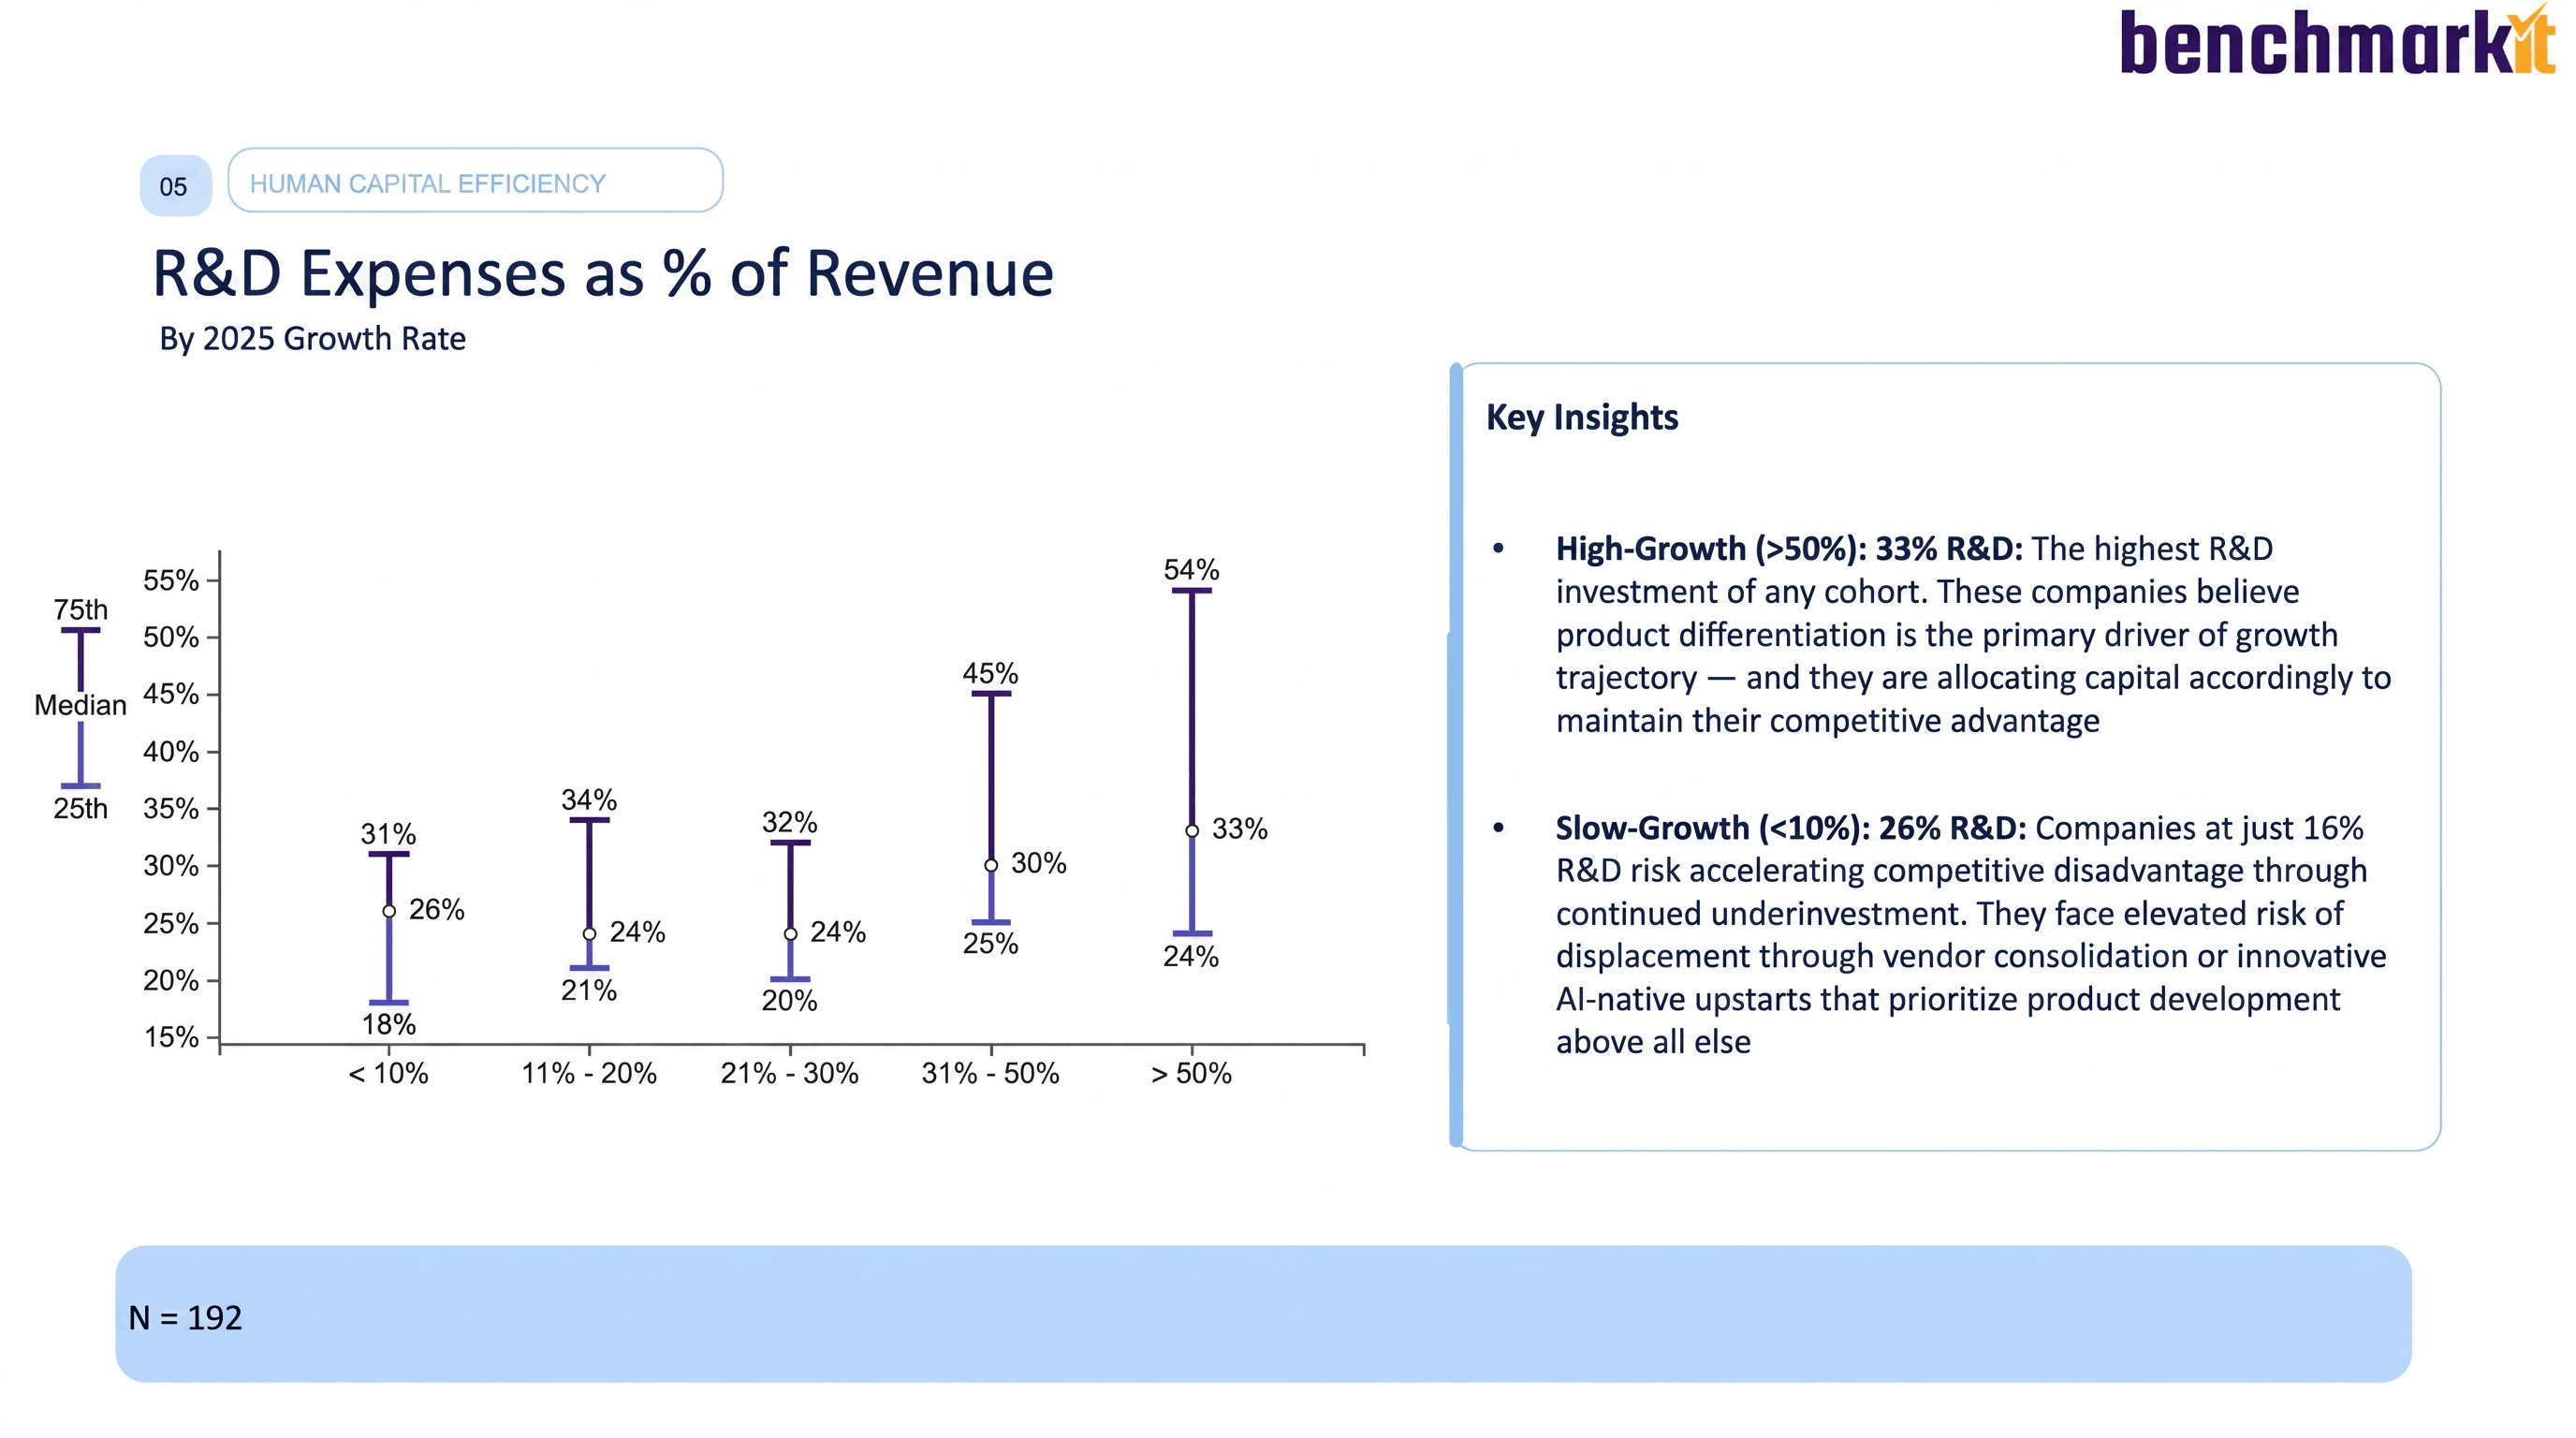
Why do high-growth SaaS companies spend more on R&D, not less?
{callout} Companies growing above 50% year-over-year run a 33% R&D ratio, the highest of any growth cohort. Slow-growth companies sit around 26%, with the bottom of that cohort dipping to 18%. {/callout}
A counter-intuitive finding from the benchmarks: the fastest-growing SaaS companies spend the most on R&D. Companies growing above 50% year-over-year run a 33% R&D ratio, the highest of any growth cohort. Companies growing at less than 10% sit at roughly 26%, with the bottom of the slow-growth cohort dipping as low as 18%.
The logic is clear once you see the data. High-growth companies treat product differentiation as the primary growth lever and allocate capital accordingly. Slow-growth companies under-invest in R&D out of profitability pressure, but the report flags this cohort as facing "elevated risk of displacement through vendor consolidation or innovative AI-native upstarts."
An 18% R&D ratio at a slow-growth company is not a sign of efficiency. It is a leading indicator of vulnerability.
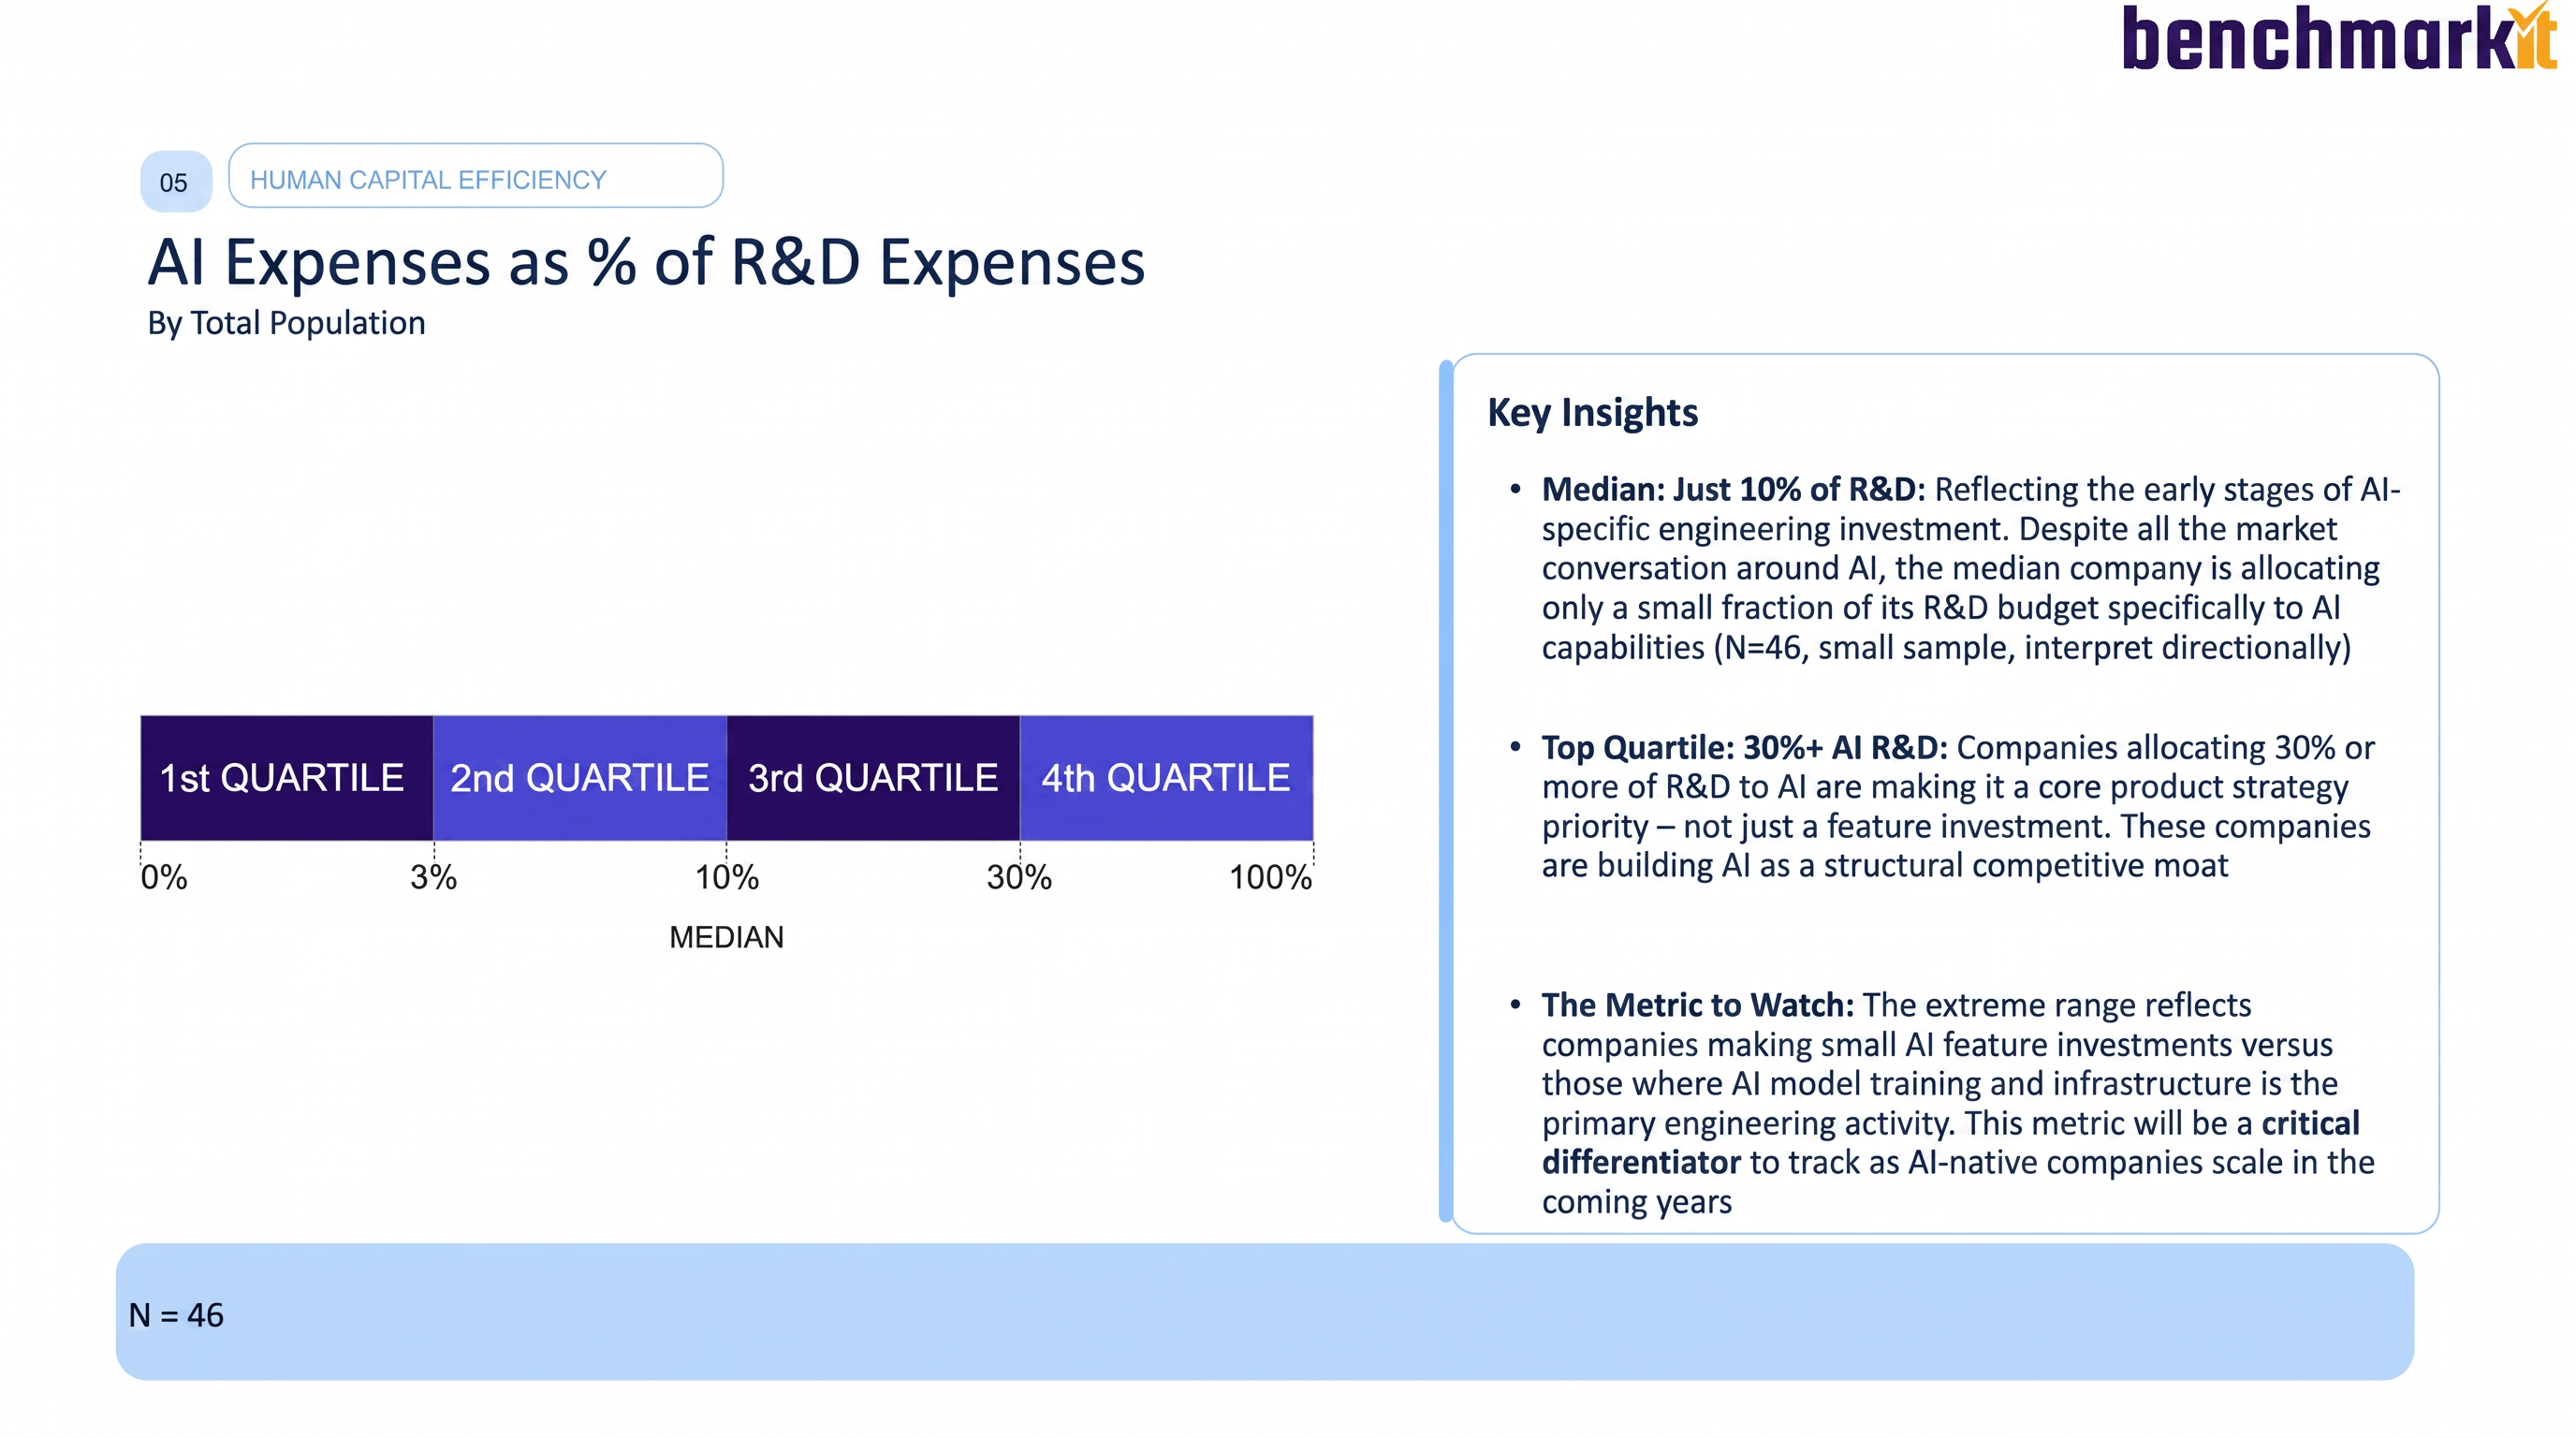
What percentage of R&D budget is going to AI?
{callout} The median SaaS company allocates 10% of its R&D budget to AI-specific investment. Top-quartile companies are already at 30%+. The report calls this "the metric to watch." {/callout}
Inside the R&D line, one sub-component is rewriting the entire engineering cost model: AI spend. The median SaaS company allocates just 10% of its R&D budget to AI-specific investment. Top-quartile companies are at 30%+, and the gap between them and the median is widening every quarter. The report explicitly flags AI as a percentage of R&D as "the metric to watch," a critical differentiator that will compound as AI-native companies scale.
For mid-market CFOs, the 10% median is not a target. It is a baseline. Companies treating AI as a feature investment (a few API calls, a chatbot demo) sit near or below it. Companies treating AI as a structural operating model redesign (agent infrastructure, fine-tuning compute, AI-augmented engineering workflows) are at 30%+ and pulling away.
By next year's benchmark cycle, the median is likely to reach 20%+. The board will be asking how your AI spend compares to peers. Build the tracking now. See the full AI spend benchmark page for the breakdown by ARR band, growth rate, and AI maturity.
Note: AI as % of R&D is based on N=46 in this cycle, which makes the figure directional rather than definitive. Sample size will grow as tracking matures.
How does your R&D ratio affect Rule of 40?
{callout} Rule of 40 improved 10 points year-over-year to a median of 25% in CY-25. R&D efficiency was one of the largest single contributors: an 8-point R&D reduction flows almost directly to operating margin. {/callout}
Rule of 40 (growth rate plus EBITDA margin) hit a median of 25% in CY-25, up 10 points year-over-year and the largest single-year gain in five years of benchmark data. R&D efficiency is a direct contributor: an 8-point R&D reduction flows almost entirely to operating margin when headcount and other R&D costs are genuinely rationalized, not just reclassified.
For board prep, the cleanest framing is to show R&D ratio, S&M ratio, G&A ratio, and resulting Rule of 40 in one view, with the year-over-year delta on each line. That lets the board see the efficiency story in a single table rather than across three separate slides. See Rule of 40 benchmarks for the full dataset. For a related SaaS benchmark, see gross margin.
How should finance teams benchmark their own R&D spend?
{callout} The benchmark is only useful if you can compare your own ratio against it regularly. The mid-market teams getting this right run R&D ratios as live metrics against the relevant cohort, not the all-SaaS median. {/callout}
The benchmark is only useful if you can compare your own ratio against it weekly, not annually. The mid-market finance teams getting this right are running R&D and OpEx ratios as live metrics: pulled from the GL, allocated against headcount data, and compared against the relevant cohort (your ARR band, your growth rate) rather than the all-SaaS median.
That is what Aleph is built for. The platform connects to your accounting system, payroll, and headcount data, computes R&D ratios in real time, and surfaces your position against the benchmark cohort. Customers see their own R&D ratio against this exact dataset without exporting to Excel. If you are between $20M and $100M ARR and building your 2026 operating plan, that is the starting point for budget planning. See what finance teams at similar-stage companies have done in customer stories.
Methodology and Sources
All benchmarks above are drawn from the 2026 SaaS & AI Performance Benchmarks report, published jointly by Aleph and Benchmarkit on July 1, 2026. The dataset includes survey responses from 342 B2B SaaS and AI-native software companies, with R&D as % of revenue reported by N=192 participants and AI as % of R&D reported by N=46. Cohort cuts include ARR band, ACV, growth rate, GTM motion, and pricing model. The full report is available for free download at Aleph × Benchmarkit 2026 Benchmarks.
Want to see your own R&D ratio against this cohort, live? Book an Aleph demo.
This page is updated regularly to reflect the latest available benchmark data.
Get FP&A best practices, research reports, and more delivered to your inbox.


