


Get FP&A best practices, research reports, and more delivered to your inbox.
Last updated: July 2026. Benchmarks reflect full-year 2025 data
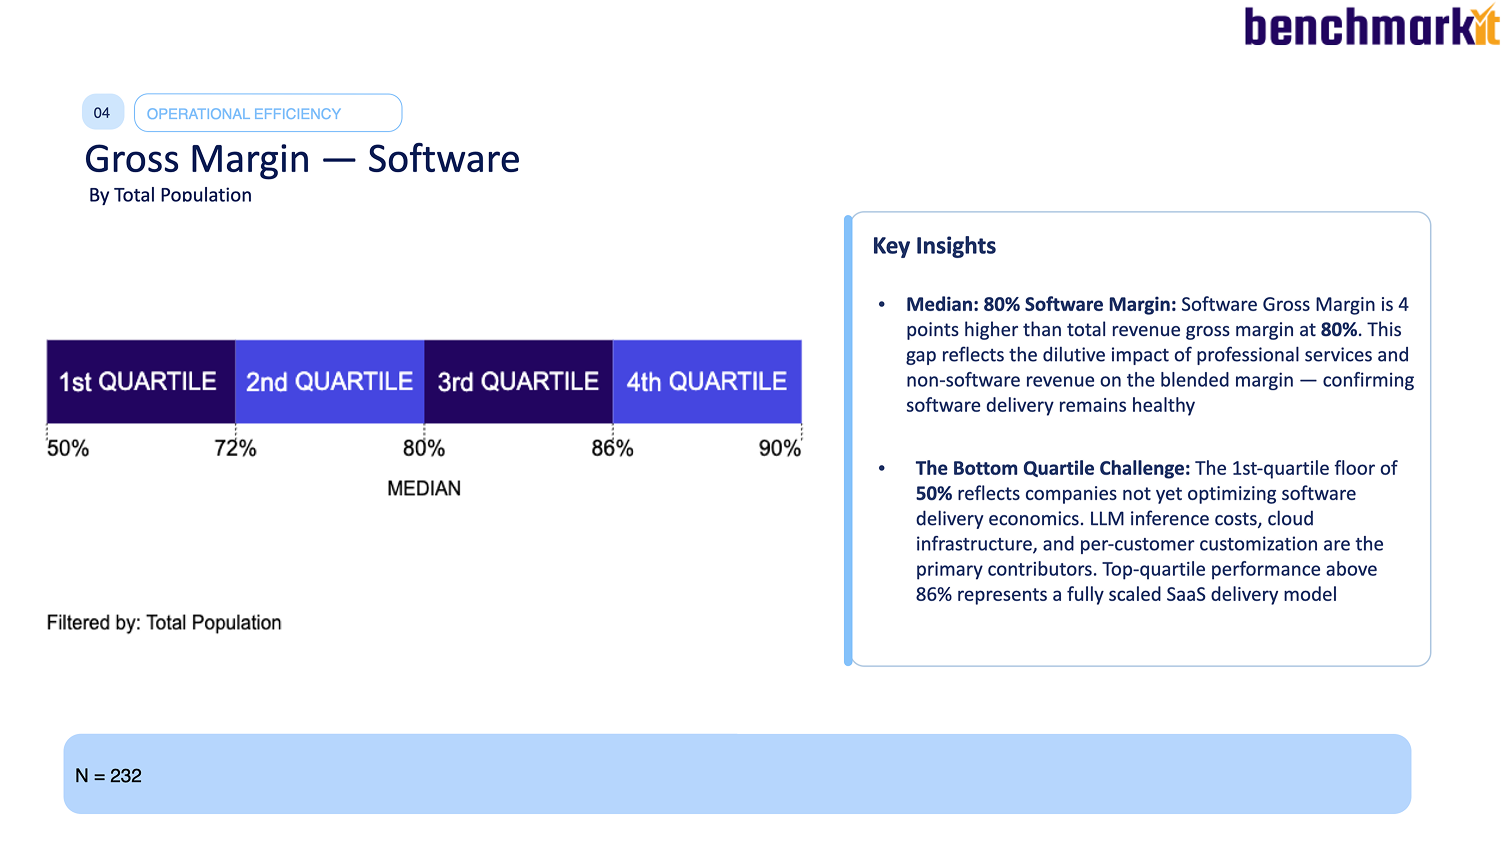
A good SaaS gross margin is 80%+ on software revenue. The 2025 median software gross margin is 80%; including services and other revenue, the blended total-revenue margin is 76%. Top-quartile companies clear 86% on software, while usage-only pricing models run lower at 62%. These figures come from full-year 2025 data across 342 SaaS and AI-native companies in the 2026 Aleph × Benchmarkit SaaS & AI Performance Benchmarks.
Gross margin is the foundation of SaaS unit economics — it determines how much of each revenue dollar is left to fund R&D, S&M, and profit. The notable 2025 finding is what did not happen: AI infrastructure costs have not yet compressed software margins at the median.
{callout}
Bottom line: Target 80%+ software gross margin (86%+ is top-tier); 75–85% is the healthy range for blended total revenue. The 2025 software median held at 80% — AI costs have not dented it at the median yet. The big exception is usage-only pricing at 62%, where compute and infrastructure costs weigh on margin.
{/callout}

What's a good SaaS gross margin?
A good SaaS gross margin is 80% or higher on software, with 86%+ best-in-class and 75–85% the healthy range for total revenue. The 2025 distribution (software margin):
- Top quartile: 86%+. A fully scaled SaaS delivery model.
- Median: 80% software / 76% total. Healthy; the gap reflects services and non-software revenue.
- Bottom quartile: 50%. Companies not yet optimizing delivery — LLM inference costs, infrastructure, and per-customer customization weigh here.
The 4-point gap between software margin (80%) and total-revenue margin (76%) is the dilutive effect of professional services and other non-recurring revenue.
What's the difference between software gross margin and total gross margin?
They measure different revenue:
- Software gross margin covers only subscription/software revenue against its direct delivery costs (hosting, infrastructure, support). 2025 median: 80%.
- Total gross margin includes everything — services, onboarding, professional fees — which carry lower margins and dilute the blend. 2025 median: 76%.
For benchmarking unit economics, software gross margin is the cleaner number; total gross margin tells you how much services drag is in your revenue mix. A wide gap between them signals a services-heavy model worth examining.
How do you calculate SaaS gross margin?
Gross Margin = (Revenue − Cost of Goods Sold) ÷ Revenue × 100
For SaaS, COGS includes hosting and cloud infrastructure, customer support, third-party software/API costs, and — increasingly — AI inference and model costs. Two best practices from the report:
- Separate software from services COGS so you can report both margins.
- Instrument AI costs distinctly. As inference, RAG, and model costs grow, isolating them from core product COGS is the only way to see their true margin impact.
Why is usage-based gross margin lower?
Usage-only pricing models post the lowest median gross margin at 62%, well below the 76–84% range of subscription variants. The reason is structural: usage-based revenue carries higher infrastructure and compute costs, especially during the ramp period before economies of scale normalize per-unit COGS. This is the margin trade-off behind usage-based pricing's other advantages — it delivers the strongest net revenue retention (108%) and ARR per employee ($291K), but at a lower gross margin. Non-seat subscription models, often priced on fixed minimum commitments, lead on margin.
Has AI compressed SaaS gross margins?
Not yet, at least not at the median. Software gross margin held remarkably stable at 79–81% across all four years of benchmark data — industry-wide LLM and AI infrastructure costs have not materially compressed margins for the typical company. Total-revenue margin slipped modestly from 77% to 76%, likely transitional cost from integrating AI into existing products.
The report is careful here: it could not prove an AI-margin-compression hypothesis with the available data, and flags that next year's benchmark will isolate AI-native product margins separately. The takeaway for now is reassurance, with a watch flag — instrument your AI costs so you can see compression if and when it arrives.

How does gross margin scale with ARR?
Software gross margin improves with scale, from 72% at sub-$5M ARR to 86% at $50M–$100M — a 14-point expansion through operational leverage:
Early-stage companies carry higher relative delivery costs and per-customer customization; at scale, infrastructure optimization and automation expand the margin. The $50M–$100M band shows a tight distribution (84–90%), meaning at that scale operational execution — not structural factors — determines where you land.
How does gross margin connect to the rest of the unit economics?
Gross margin is the input that flows into nearly every other metric. It sets the ceiling on the Rule of 40 margin component, it is the basis for a properly calculated CLTV:CAC ratio (lifetime value must use gross-margin-adjusted revenue), and it determines how much of each dollar is left to reinvest in growth. A company defending an 80%+ software margin has structurally more room to invest than one at 60% — which is why the usage-based margin trade-off has to be weighed against its retention and efficiency gains.
How should finance teams benchmark and improve their own gross margin?
- Report software and total margin separately. The blended number hides whether a services-heavy mix is dragging you down.
- Instrument AI costs now. Inference and model costs are the most likely future source of compression; you cannot manage what you do not measure separately.
- Benchmark by pricing model and scale. A usage-based company at 65% is near its cohort; a subscription company at 65% has a delivery-cost problem.
Seeing margin clearly means tying revenue and COGS — including variable cloud and AI costs — into one model. Aleph connects the GL and billing data so gross margin, and its components by product line and pricing model, stay current instead of being rebuilt by hand each quarter.
See how finance teams track gross margin and unit economics in Aleph → Book a demo.
Methodology and sources
These benchmarks come from the 2026 SaaS & AI Performance Benchmarks report, published jointly by Aleph and Benchmarkit on June 1, 2026. The report draws on 342 B2B SaaS and AI-native software companies; gross-margin figures are based on 228–232 participants depending on the cut. Figures reflect full-year 2025 (CY-2025) actuals. The underlying metrics are explorable in Benchmarkit's interactive benchmarks.
{callout}
A note on the year: This report was published in 2026, but the benchmarks reflect full-year 2025 results — the latest complete data. Where this page says “2025,” it means the data year. “2026” refers to the report edition and the current planning year.
{/callout}
This page is reviewed against each new edition of the benchmark data.
Get FP&A best practices, research reports, and more delivered to your inbox.


