


Get FP&A best practices, research reports, and more delivered to your inbox.
Your physical fitness is (painfully) visible to yourself and others. Look in the mirror, step on a scale, time yourself running a mile…the benchmarks are obvious and everywhere.
The same can’t be said for your FP&A function.
There’s no mirror, no scale, no mile times to compare your team against. Most finance leaders have a gut feel for how effective their team is, but very few have a structured way to validate it.
And even if you could measure this type of thing—who exactly would you be comparing against? Those north of 50 shouldn’t compare their fitness to a bulletproof 20-year-old. In the same way, a Series A finance team shouldn’t compare its FP&A capabilities to a public company’s. The available resources (and output demands) are fundamentally different.
We think there’s a better way to measure FP&A fitness — one that adjusts for your team’s size and stage.
That’s what this post, and the free tool we built, is about: the journey to peak FP&A performance.
Peak FP&A performance: What’s foundational vs relative?
8 hours of sleep, a balanced diet, and regular exercise all matter whether you’re 25 or 65. FP&A has the same kind of universal principles. Public multinationals and scrappy seed-stage startups both need trusted data, a functioning close process, and the ability to collaborate with other teams. These fundamentals don't change with size.
But while certain principles are universal, context also matters. A 60 year-old who can run a 7-minute mile is in elite shape. For a 22 year-old athlete, it’s average. Same performance, different standard.
FP&A works the same way. For a public company, “trusted data” means a governed chart of accounts, automated reconciliations, and audit-ready reporting on demand. For a Series A startup, it might just mean clean actuals the CEO and investors trust without caveats.
So, instead of asking “is our FP&A team doing well?,” the better question is “are we where we should be for our stage?”
Six vital signs of FP&A fitness
Every FP&A team could use its own version of an annual physical.
In our experience working with finance teams, there are six “vital signs” that provide a solid gauge of how fit they are for their stage.
1. Foundation & actuals (your cardio base)
Trusted, accessible numbers are the heart of any finance function. It’s the foundation upon which everything else is built: forecasts, board decks, strategic decisions, etc. Intricate models and snazzy board decks are inherently fragile if the underlying numbers take three weeks to produce and nobody fully trusts them.
What "good" looks like here depends on stage. An early-stage company might be doing fine with a 7–10 day close and a mostly-centralized data infrastructure. A public company, on the other hand, should be operating in near real-time with fully governed data, access controls, and portfolio-level visibility into business cases and post-investment reviews.
Close speed is usually one of the first things teams improve. Standardized business case evaluation and portfolio-level visibility tend to come later.
{callout}
Pulse checks:
- How fast can you close the books?
- Do you have a single source of truth for financial and operational data?
- Are KPI definitions consistent across the org?
{/callout}
2. Data quality & governance (nutrition & recovery)
You can’t out-train a bad diet, and you can’t overcome poor data governance.
Producing numbers quickly is one thing. Making sure your data (and definitions) remain controlled and consistent as the business scales is something else entirely. Having both is what determines whether your reporting is durable or a house of cards.
Early-stage teams are almost always reactive here, which is understandable. Reports get built off CSV exports, and version control means naming the file "Q3_forecast_v4_FINAL_actualfinal." When the team is small and everyone's in the same room, that might work.
Then you add a second entity. Or a new product line. Or a PE sponsor who wants to see the numbers sliced differently. Suddenly, metric definitions start drifting, and your data layer becomes a liability.
When the governance layer is weak, everything above it—your models, your forecasts, your narratives—becomes political instead of analytical. And that's a hole that's very hard to dig out of.
{callout}
Pulse checks:
- Who owns metric definitions? And are they documented?
- How do you monitor data integrity over time?
- Can you trace a number from dashboard back to source?
{/callout}
3. Planning & modeling (strength training)
Strength training builds the capacity to handle heavier loads over time. Modeling and forecasting does the same for your business. It’s your ability to produce forward-looking views that hold up when someone pressure-tests the assumptions.
When you’re small, planning is straightforward: you put together a budget once a year, maybe over a 3–4 month cycle. Revenue and headcount live in separate spreadsheets, and forecasts get updated quarterly. The goal is to have a plan that's directionally right and easy to adjust.
But as the business scales and complexity increases, siloed planning starts creating real problems. Revenue is being forecasted in one model, headcount in another, Opex in a third, and nobody's checking whether they tell the same story. The board asks a question that requires pulling from all three, and what should be a quick answer turns into a two-week reconciliation exercise.
The best teams plan at scale by running continuous or rolling cycles with fully-integrated models. They can walk confidently into a board meeting knowing they’re able to defend every assumption in the model.
{callout}
Pulse checks:
- How long does your budget cycle take?
- Is planning integrated across revenue, headcount, and Opex, or siloed?
- Are your models driven by real operational drivers or topline assumptions?
{/callout}
4. Agility & decision velocity (speed & conditioning)
Most athletes don’t train for peak performance at the gym—they do it so they’re ready for whatever happens on the field
A meticulously-built annual budget that’s unable to flex is essentially useless. Anyone who’s built one before knows to expect the unexpected. When a market change or supply shock comes out of nowhere, your model needs to be able to accommodate it. It doesn’t matter how polished it looked in January.
This is one of the vital signs that often gets worse before it gets better. Early-stage teams tend to be fast by default: there's one model, one owner, and little red tape to slow things down.
But then you add stakeholders who require signoffs, and the whole thing grinds to a halt.
The teams that stay agile at scale invest in it deliberately. They build scenario templates in advance so they're ready to run when the question comes in. They embed self-serve dashboards directly into stakeholder workflows so people aren't waiting on FP&A to pull a number.
Governance and speed aren't mutually exclusive. The best teams build systems that support both.
{callout}
Pulse checks:
- How quickly can you produce a board-ready package after close?
- Can budgets be reallocated mid-cycle without a fire drill?
- Do stakeholders self-serve on reporting or wait for FP&A to deliver it?
{/callout}
5. Cross-functional collaboration (team sport)
Individual talent matters, but championships are won by teams that play well together. An FP&A function that produces incredible analysis but can't get anyone to act on it is like a star player who won't pass the ball.
This is one dimension where early-stage teams can punch above their weight. When FP&A sits two seats from the CEO and has a direct line to every major decision, perception and influence come naturally. You don't need a formal intake process when the whole company is in one Slack channel.
But then (and hopefully you’re sensing a theme here) comes scale and everything changes. The FP&A team grows, but the scope of requests grows faster. Without structure, you fall into a reactive cycle—whoever asks loudest gets attention, and long-term strategic work gets pushed aside. Leadership starts to see FP&A as a reporting function because that's what FP&A keeps delivering.
The teams that break out of this pattern do a few things differently:
- They have a real intake process. Not just a queue, but a way to prioritize requests based on strategic impact.
- They translate company strategy into explicit financial targets and tradeoffs, so FP&A actually shapes resource allocation instead of just tracking it.
- They earn credibility over time, so when FP&A has a point of view on where to invest or cut, it carries weight.
{callout}
Pulse checks
- How does leadership perceive FP&A—strategic partner or reporting function?
- Is there a structured intake process for FP&A requests?
- Does FP&A influence resource allocation or just report on it?
{/callout}
6. Reporting & influence (form & coaching)
Raw strength can only take you so far. Good form is what takes athletes (and FP&A teams) to the next level.
You can have all the raw analytical horsepower in the world, but if the output is a 40-page deck that reads the same for the board, executives, and the department heads, you're leaving influence on the table.
Early-stage teams might share a P&L with some red and green conditional formatting and let stakeholders draw their own conclusions. That works when everyone's in the same room and context is shared. The CEO already knows why revenue dipped—they were on the call when the deal fell through.
But this structure comes unglued pretty quickly.
As the company grows, FP&A’s audience fragments. The board wants a different narrative than the exec team. Department heads need different cuts than the CFO.
The best FP&A teams build narratives with clear implications and recommended actions—not just "revenue missed by 4%" but "revenue missed by 4%, here's why, here's the impact on the full-year outlook, and here are two options for how to close the gap."
At scale, recurring reporting should be largely automated. The real energy then goes into exception-based analysis and forward-looking storytelling. FP&A stops being the team that tells you what happened and becomes the team that tells you what to do about it.
{callout}
Pulse checks
- How automated is your recurring reporting?
- Do you tailor financial communication to different audiences?
- How proactively do you flag risks and opportunities before they become surprises?
{/callout}
Introducing the FP&A Fitness Test
FP&A teams rely on benchmarks to understand how their business is performing. But there hasn’t been a good way to benchmark the finance function itself.
So we built one.
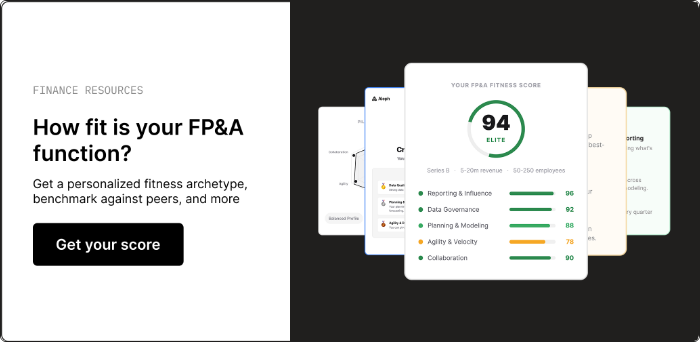
What’s the FP&A fitness test?
A free, 24-question assessment that takes about 5 minutes to complete.
Start by setting up your company profile: stage, revenue, headcount, team size, and complexity factors. Then you answer questions across all six vital signs:
- Foundation & actuals
- Data quality & governance
- Planning & modeling
- Agility & decision velocity
- Cross-functional collaboration
- Reporting & influence
The scoring adjusts to your context. A Series A team isn’t measured against public-company standards. A large, complex org doesn’t get credit for capabilities that should be table stakes.
What do I get out of it?
- A blended maturity score calibrated to your company profile
- A radar chart showing strengths and gaps across all six dimensions
- A fitness archetype that captures your team’s overall profile
You’ll also get a downloadable PDF summary and a shareable badge. Ultimately, the goal is to provide a clear, contextual view of where your team stands, what to focus on next, and what peak FP&A performance realistically looks like for a company like yours.
Check it out—it’s free and only takes a few minutes.
Get FP&A best practices, research reports, and more delivered to your inbox.


