


Get FP&A best practices, research reports, and more delivered to your inbox.
Last updated: June 2026. Benchmarks reflect full-year 2025 data
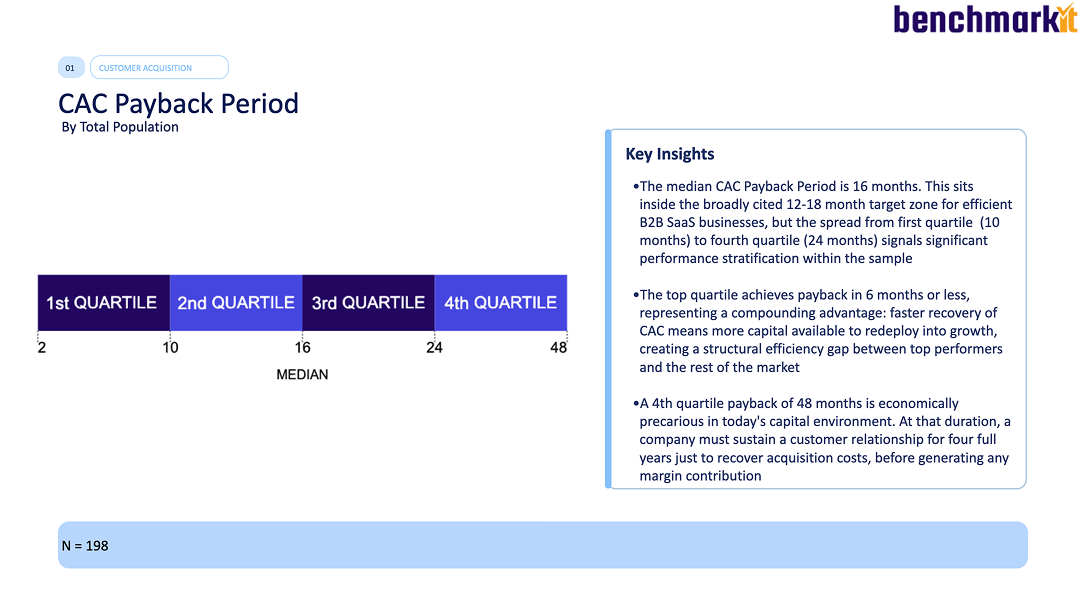
The median B2B SaaS company recovers its customer acquisition cost in 16 months. Top-quartile companies do it in 6 months or fewer; the bottom quartile takes 24 months or more. These figures come from full-year 2025 actuals across 342 SaaS and AI-native software companies in the 2026 Aleph × Benchmarkit SaaS & AI Performance Benchmarks.
A 16-month median sits inside the 12–18 month zone most investors treat as efficient, but the spread is what matters: the gap between a 6-month and a 24-month payback decides how much capital you can recycle back into growth, and how fast.
Bottom line: Aim to recover CAC in under 18 months, and treat under 12 as the bar for a company that can self-fund growth. The 2025 median is 16 months and improving — but the top quartile is pulling away at 6 months or less, so a “fine” payback period is quietly becoming a competitive disadvantage.

What counts as a good CAC payback period in 2026?
A good CAC payback period for B2B SaaS is under 18 months, with under 12 months marking top-tier efficiency. Here is how the 2025 benchmark distribution breaks down:
- Top quartile: ≤6 months. A compounding advantage — CAC comes back fast enough to redeploy into the next cohort of growth.
- Median: 16 months. Healthy, inside the cited 12–18 month target band.
- Bottom quartile: ≥24 months. Workable but capital-intensive.
- Worst case in the sample: 48 months. Economically precarious — four years to recover acquisition cost before contributing any margin.
The benchmark you compare yourself to should match your stage and motion, not the headline median. The cuts below show why — and for the wider set of metrics this one sits among, see our guide to the SaaS metrics that matter.
How do you calculate CAC payback period?
CAC payback period is the number of months of gross profit it takes to recover the sales and marketing cost of acquiring a customer:
CAC Payback (months) = Sales & Marketing expense (prior period) ÷ (New ARR added × Gross margin %) × 12
Two details change the answer materially:
- Use gross-margin-adjusted revenue, not raw ARR. A payback period that ignores cost of delivery flatters low-margin businesses.
- Lag the S&M spend. The S&M that closed this quarter's new ARR was largely spent in prior periods. Mismatching the timing is the most common way the number gets reported too low.
Is CAC payback period improving?
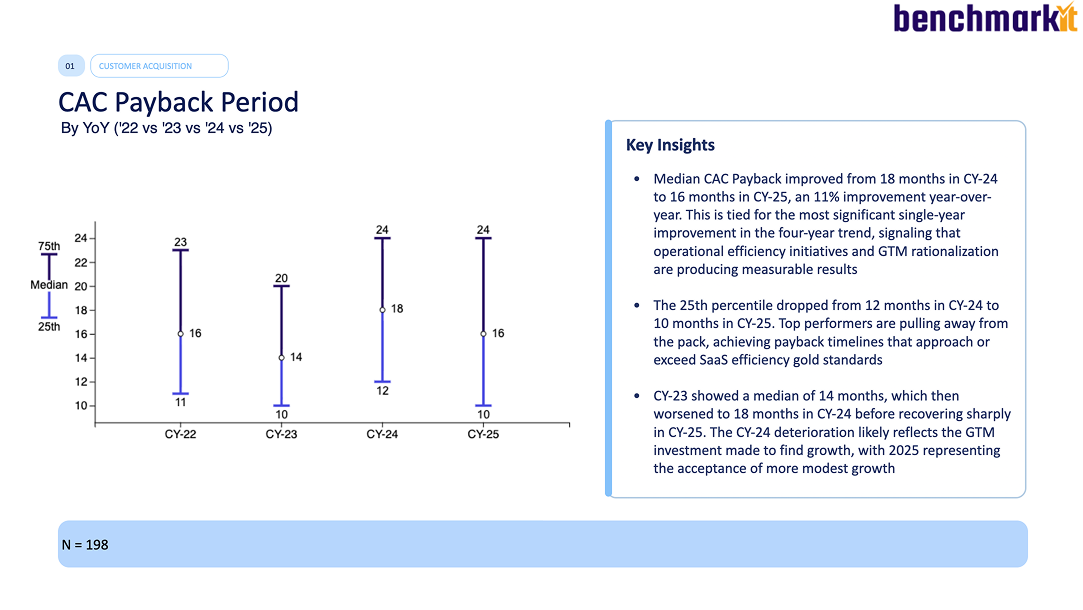
Yes — 2025 was a turnaround year. The median improved from 18 months in 2024 to 16 months in 2025, an 11% gain and tied for the largest single-year improvement in four years of data. The 25th percentile dropped from 12 to 10 months, so the most efficient companies got more efficient too.
The improvement came from go-to-market rationalization — tighter spend and better targeting — rather than from spending more. That is the recurring theme of the 2025 data: efficiency recovered because companies cut, and the open question for 2026 is whether that efficiency is durable as they reinvest.
How does CAC payback vary by growth rate?
The fastest-growing companies recover CAC the fastest — they are not buying growth with inefficient acquisition.
The counterintuitive cohort is 21–30% growth at 22 months. Companies in this band are often absorbing elevated CAC to find their next gear, before efficiency gains catch up.
How does deal size (ACV) change the benchmark?
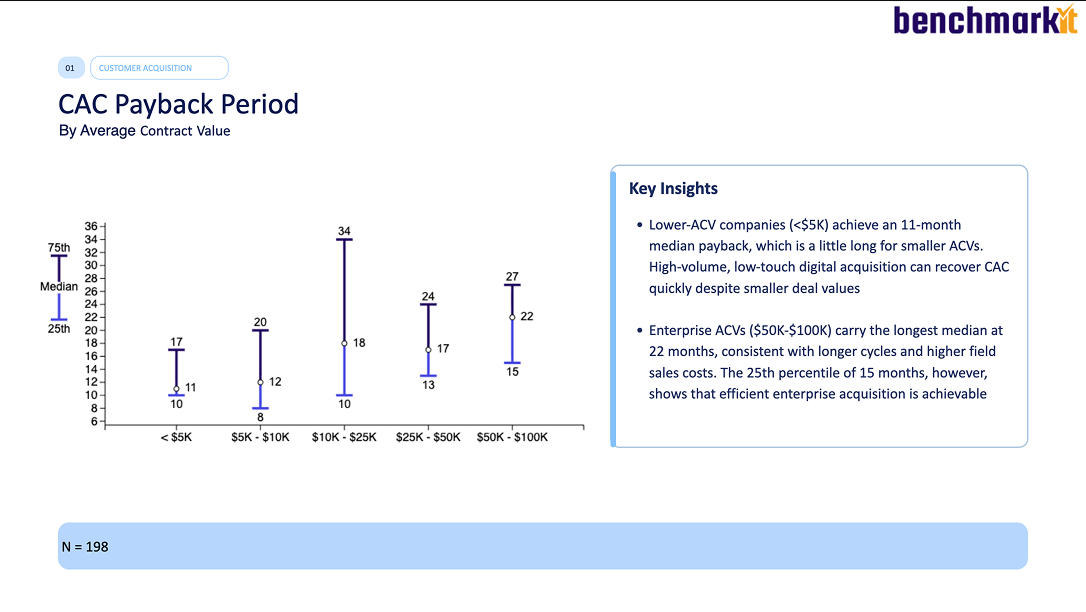
Larger deals take longer to pay back, but the relationship is not linear:
- Sub-$5K ACV: 11-month median. High-volume, low-touch digital acquisition recovers CAC quickly despite small deal sizes.
- $50K–$100K ACV (enterprise): 22-month median. Longer cycles and field-sales costs push payback out — though the 25th percentile of 15 months shows efficient enterprise acquisition is achievable.
If you sell enterprise, benchmarking yourself against the all-in 16-month median will make you look worse than you are. Compare within your ACV band.
Does vertical or horizontal SaaS recover CAC faster?
Horizontal B2B SaaS recovers CAC faster at the median — 14 months versus 18 months for vertical SaaS. Smaller addressable markets, specialized sales knowledge, and longer evaluation cycles structurally raise acquisition cost in vertical markets. The trade-off: vertical SaaS earns it back through retention, posting a higher lifetime-value-to-CAC ratio (5.6x vs 4.1x). On a buying-decision page, payback period should always be read alongside CLTV:CAC, not in isolation.
How does CAC payback connect to the other GTM metrics?
CAC payback is one of five GTM efficiency metrics that moved together in 2025, and reading them as a set is how you tell durable efficiency from a one-time cut:
- SaaS Magic Number: 1.37 median — crossed the critical 1.0 line for the first time in years.
- Blended CAC Ratio: $1.30 — $1.30 of S&M per $1 of new ARR, down 7% year-over-year.
- New Name CAC Ratio: $1.63 — improved ~19% year-over-year.
When CAC payback, the Magic Number, and the Rule of 40 all sit in the top quartile, the report's guidance is that accelerating GTM investment is prudent. When they do not, more spend mostly buys a worse payback period. It is also how investors read the business — see how Silicon Valley VCs look at these metrics. For a related SaaS benchmark, see ARR per employee.
How should finance teams benchmark and improve their own CAC payback?
- Segment before you compare. Pull your payback period by growth cohort, ACV band, and GTM motion — then benchmark against the matching segment above, not the 16-month median.
- Fix the inputs, not the output. A long payback period is usually a symptom: low gross margin, mistimed S&M, or a CAC that is too high for the deal size. Trace it to one of those.
- Watch it as a trend, not a snapshot. A single quarter is noisy. The metric earns its keep as a rolling indicator of GTM health.
This is where having S&M spend, new ARR, and gross margin in one connected model matters — most finance teams lose days each quarter stitching the inputs together from the CRM, the GL, and a spreadsheet. Aleph pulls those sources into a live model so CAC payback, Magic Number, and Rule of 40 update as the underlying numbers do, instead of being rebuilt by hand for each board deck.
See how finance teams track CAC payback and the full GTM metric set in Aleph → Book a demo.
Methodology and sources
These benchmarks come from the 2026 SaaS & AI Performance Benchmarks report, published jointly by Aleph and Benchmarkit on June 1, 2026. The report draws on 342 B2B SaaS and AI-native software companies; CAC payback figures are based on the 198 participants that reported the metric. Figures reflect full-year 2025 (CY-2025) actuals. The underlying metrics are explorable in Benchmarkit's interactive benchmarks.
{callout}
A note on the year: This report was published in 2026, but the benchmarks reflect full-year 2025 results — the latest complete data. Where this page says “2025,” it means the data year. “2026” refers to the report edition and the current planning year.
{/callout}
This page is reviewed against each new edition of the benchmark data.
Get FP&A best practices, research reports, and more delivered to your inbox.


