


Get FP&A best practices, research reports, and more delivered to your inbox.
Last updated: June 2026. Benchmarks reflect full-year 2025 data
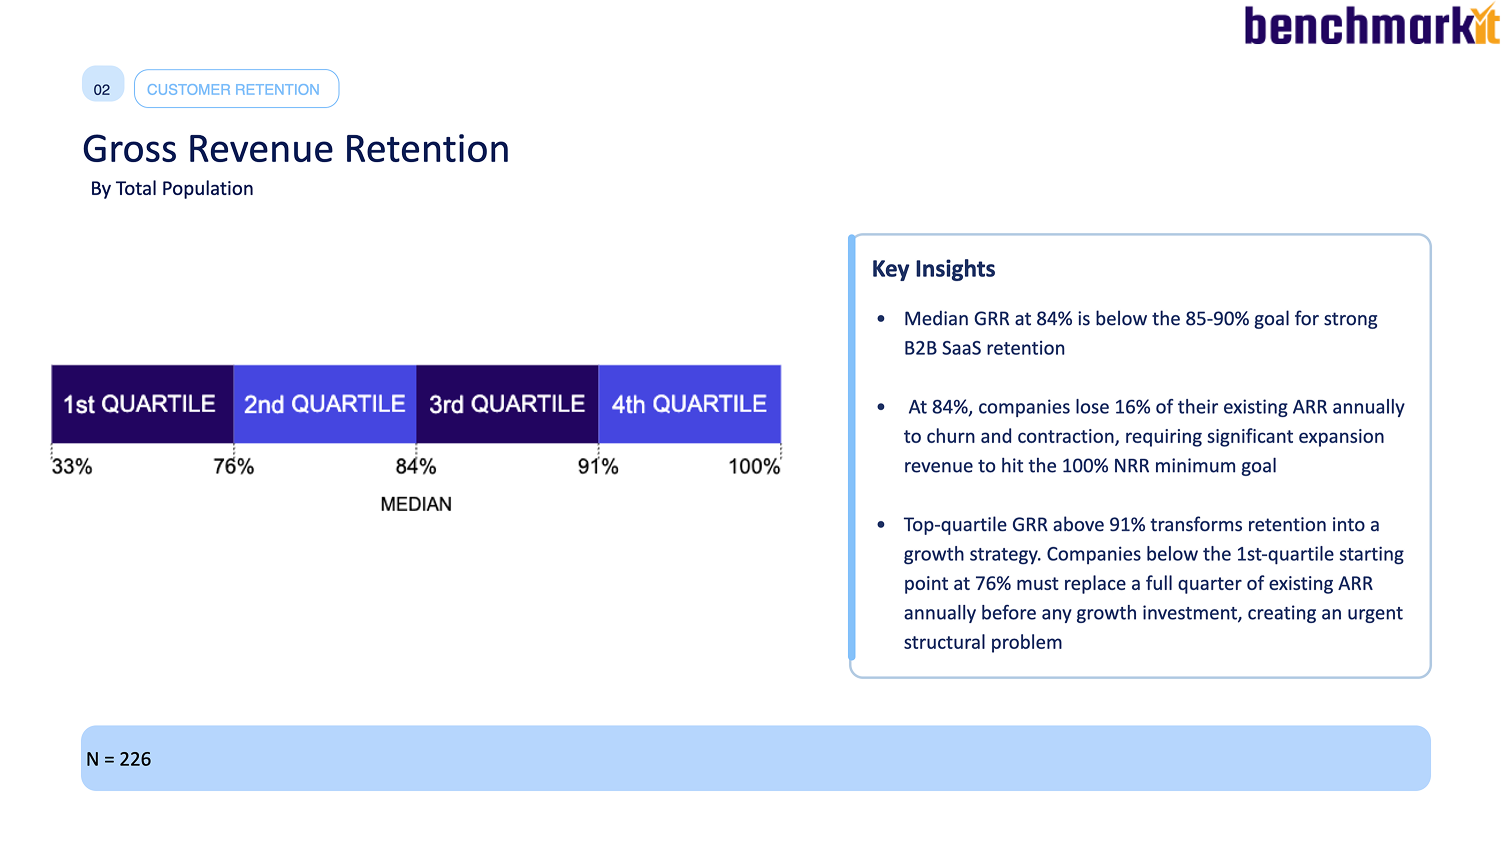
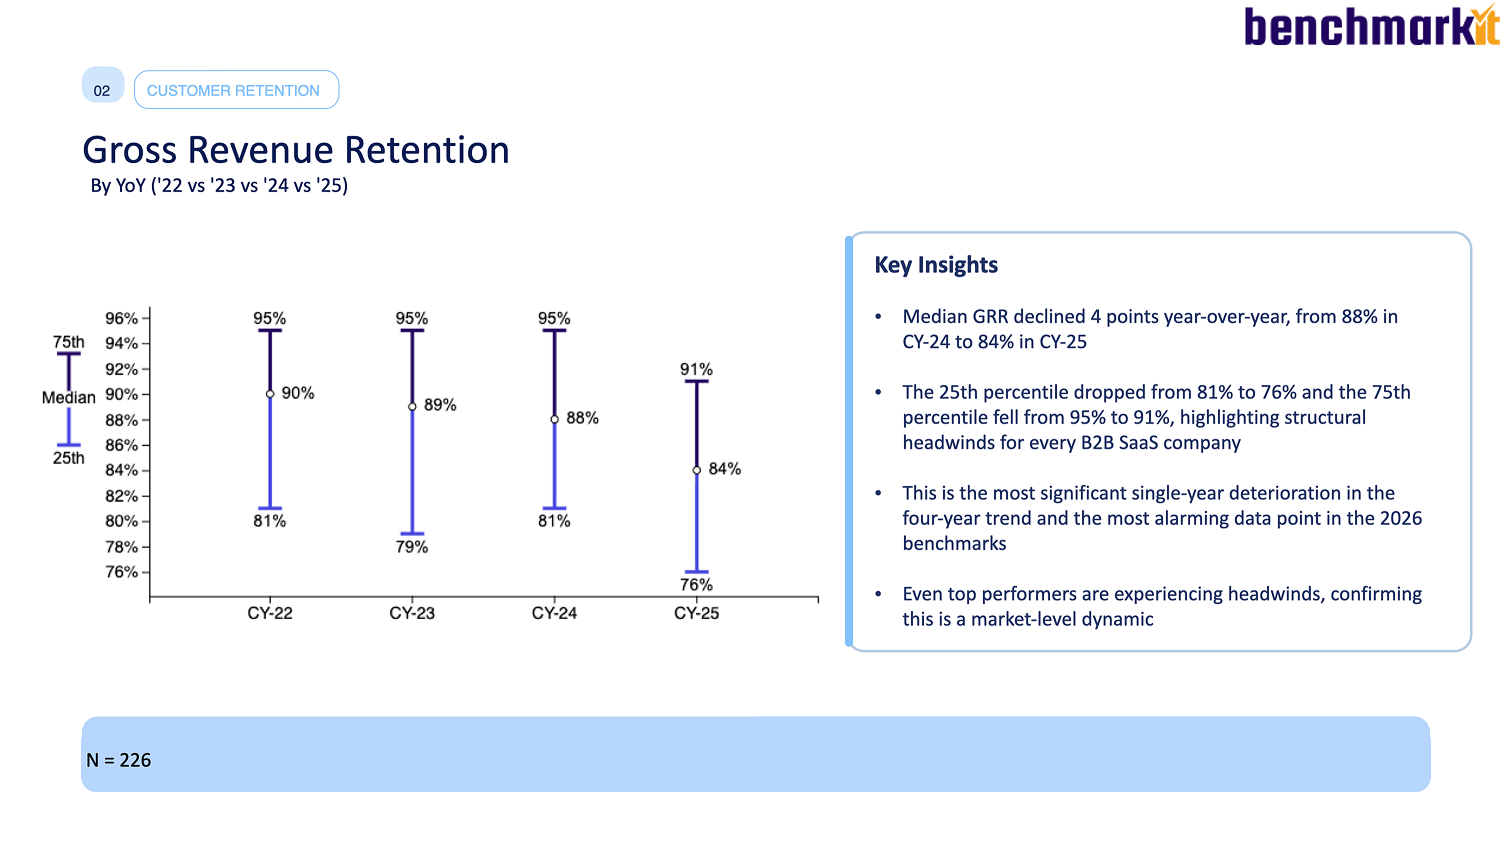
The median B2B SaaS company has a gross revenue retention (GRR) rate of 84% — below the 85–90% mark that signals strong retention, and down 4 points from 88% the year before. That single-year drop is the most alarming data point in this year's benchmarks. Top-quartile companies hold 91%; the bottom quartile sits at 76%. These figures come from full-year 2025 data across 342 SaaS and AI-native companies in the 2026 Aleph × Benchmarkit SaaS & AI Performance Benchmarks.
At 84%, the typical company loses 16% of its existing ARR every year to churn and contraction — before it adds a dollar of new business. And because the decline hit even top performers, it reads as a market-level shift, not a company-level execution miss.
{callout}
Bottom line: Aim for 85%+ GRR, with 90%+ marking top-tier durability. The 2025 median of 84% is below that bar and falling — a 4-point drop that hit every quartile. GRR is now the leading indicator to watch, because it is the floor your whole growth model is built on.
{/callout}

What's a good GRR rate in 2026?
A good gross revenue retention rate is 85% or higher, with 90%+ marking best-in-class durability. Here is the 2025 distribution:
- Top quartile: 91%+. Retention strong enough to function as a growth strategy on its own.
- Median: 84%. Below the 85–90% goal — 16% of ARR lost annually before any growth.
- Bottom quartile: 76%. A structural problem: nearly a quarter of ARR must be replaced each year just to stand still.
GRR measures pure retention — what you keep before any expansion. That is why it is the most honest read on the durability of your revenue base, and one of the SaaS metrics that matter most as growth slows.
What's the difference between GRR and NRR?
GRR and net revenue retention (NRR) measure different things, and the gap between them tells the real story:
- Gross Revenue Retention (GRR) excludes expansion. It only counts what you kept, so it caps at 100%. 2025 median: 84%.
- Net Revenue Retention (NRR) adds expansion back in and can exceed 100%. 2025 median: 102%.
The 18-point spread between the median NRR (102%) and median GRR (84%) is how much work expansion is doing to paper over churn. A healthy NRR built on a weak GRR is a warning sign, not a victory.
{callout}
Definition: GRR = (starting ARR − contraction − churn) ÷ starting ARR. Because it never adds expansion, GRR is capped at 100% — unlike NRR.
{/callout}
How do you calculate gross revenue retention?
GRR = (Starting ARR − Churned ARR − Contraction ARR) ÷ Starting ARR × 100
Measured for a fixed customer cohort over a set period, usually 12 months. The key discipline is to exclude all expansion and new-logo revenue — GRR is strictly about what you held onto from the customers you started with. Any upsell leaking into the calculation inflates the number and hides the churn you most need to see.
Why did GRR fall 4 points in 2025?
The decline from 88% to 84% was broad and structural, not concentrated in weak operators. The 25th percentile dropped from 81% to 76% and the 75th percentile fell from 95% to 91% — every quartile moved down together. When even top performers lose ground, the cause is market-level, not execution.
The report ties it to buyers re-evaluating their stacks: longer sales cycles, elevated ROI scrutiny, and customers weighing incumbents against AI-native alternatives in parallel. Some of that churn is budget discipline; some is genuine substitution. Either way, the bucket got leakier across the board in 2025.
How does GRR vary by go-to-market motion?
GTM motion is the sharpest cut in the GRR data — enterprise sales relationships retain materially better than self-serve:
Sales-led companies retain 8–9 points better than PLG. The structural advantage of high-touch relationships — named sponsors, dedicated success managers, formal business reviews — translates directly into gross retention. PLG companies need a commercial overlay to close that gap.
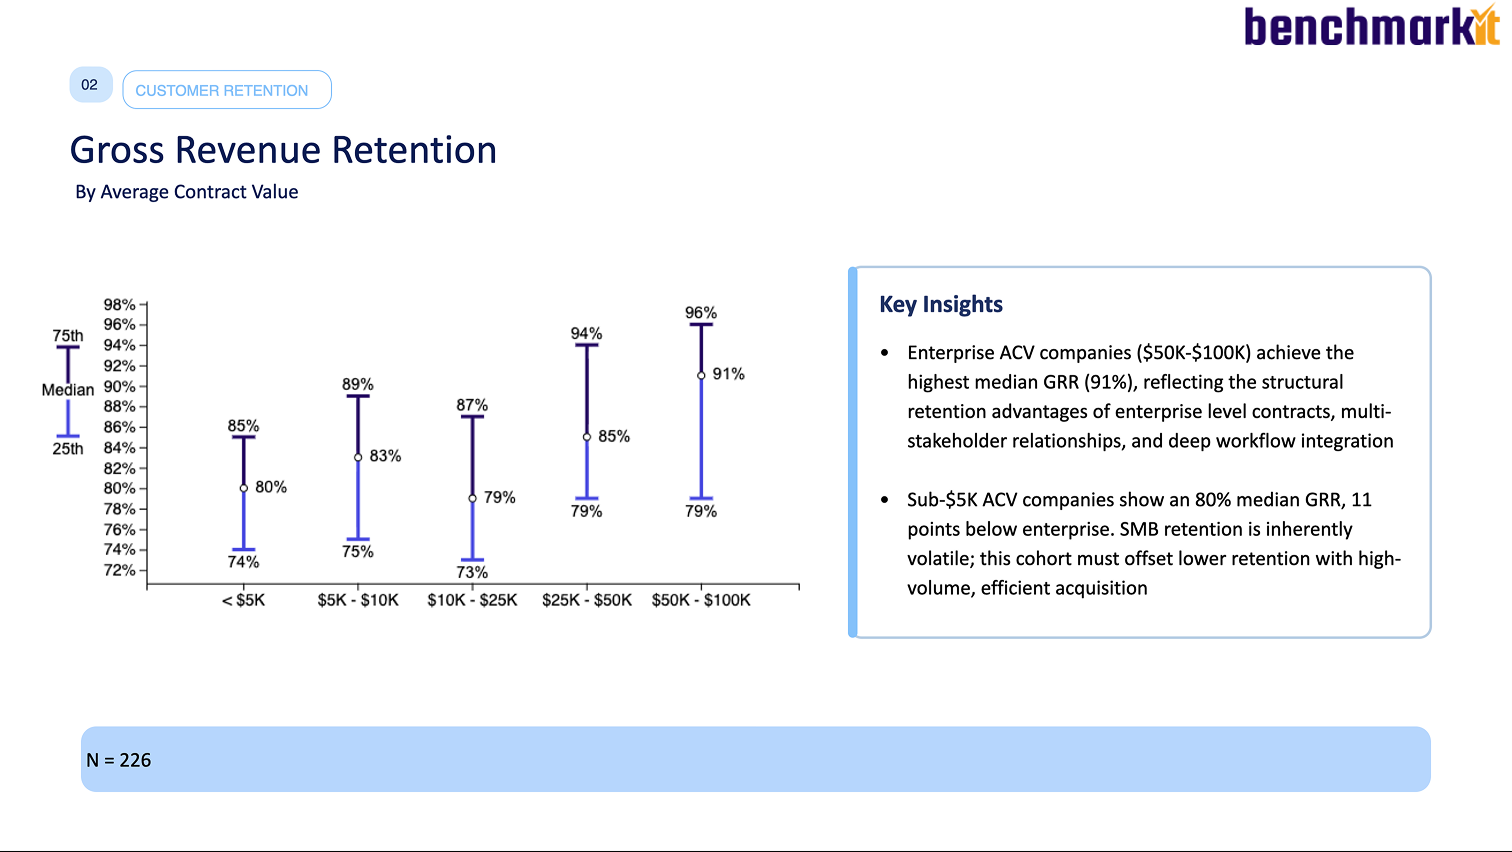
How does GRR vary by deal size and growth rate?
Bigger deals and steady growth both retain better:
- By ACV: enterprise deals ($50K–$100K) post the highest median GRR at 91%, reflecting multi-stakeholder relationships and deep workflow integration. Sub-$5K ACV sits at 80% — SMB retention is structurally more volatile.
- By growth rate: the 11–20% growth cohort retains best at 89%, while companies growing under 10% sit at 79%. Poor retention and slow growth feed each other.
How does GRR connect to the rest of the efficiency story?
GRR is the floor everything else is built on. A weak GRR raises the bar for every other metric: it forces a higher NRR just to break even, it pushes up CAC payback at the portfolio level because you must replace churned ARR with new logos at $1.63 per dollar instead of expanding at $0.80, and it drags the Rule of 40 through both the growth and efficiency sides. That is why the report frames GRR as the leading indicator of ARR durability.
How should finance teams benchmark and improve their own GRR?
- Report GRR alongside NRR, always. The spread between them is your most important retention diagnostic — it tells you how much expansion is masking.
- Segment by motion and ACV. A PLG company at 82% is outperforming its cohort; a sales-led enterprise company at 82% is underperforming its. The 84% median hides this.
- Separate contraction from logo churn. They have different fixes — contraction is often a pricing or value-realization problem, while logo churn is an onboarding or fit problem.
Seeing churn and contraction clearly means having renewals, downgrades, and cancellations tracked in the same model as your ARR. Aleph connects billing and CRM data so GRR, NRR, and the contraction-versus-churn breakdown stay current and segmentable, instead of being reconstructed by hand each quarter.
See how finance teams track GRR, NRR, and churn in Aleph → Book a demo.
Methodology and sources
These benchmarks come from the 2026 SaaS & AI Performance Benchmarks report, published jointly by Aleph and Benchmarkit on June 1, 2026. The report draws on 342 B2B SaaS and AI-native software companies; GRR figures are based on the 226 participants that reported the metric. Figures reflect full-year 2025 (CY-2025) actuals. The underlying metrics are explorable in Benchmarkit's interactive benchmarks.
{callout}
A note on the year: This report was published in 2026, but the benchmarks reflect full-year 2025 results — the latest complete data. Where this page says “2025,” it means the data year. “2026” refers to the report edition and the current planning year.
{/callout}
This page is reviewed against each new edition of the benchmark data.
Get FP&A best practices, research reports, and more delivered to your inbox.


