


Get FP&A best practices, research reports, and more delivered to your inbox.
By almost every efficiency metric, 2025 looked like a banner year for SaaS.
- CAC payback improved from 18 months to 16
- Rule of 40 jumped from 15% to 25%, the biggest single-year gain in five years
- ARR per employee climbed 29% to $193K
After a turbulent start to the 2020s, it looked like the software market had finally found its footing again.
At least on paper…
While the average SaaS company got more efficient last year, it also got more fragile.
- Median growth fell to 20%, down from 30% in 2022
- Gross revenue retention dropped from 88% to 84%
- Seat-based companies slipped below the 100% NRR line
The obvious through-line on these trends is AI. But the story is much more nuanced than “AI is eating software.” AI is changing buyer expectations, pressuring seat-based pricing, and forcing companies to rethink how they package, monetize, and defend value.
Here are the 5 biggest takeaways from Benchmarkit’s 2026 SaaS and AI Metrics Benchmarks report, based on survey data from 342 B2B SaaS and AI-native software companies.

1. The recovery is real, but the story is mixed
The Rule of 40 is a VC-favored metric for SaaS companies. It says your revenue growth rate plus your profit margin should add up to at least 40%.
Why do VCs use this rule? SaaS companies can be judged on growth or profitability, but eventually the two need to balance. If you’re growing 50%, investors may tolerate more burn. If you’re growing 10%, they’ll expect stronger margins. The Rule of 40 gives investors and operators a quick way to judge whether that tradeoff is working.
And by that measure, 2025 looked like a major step forward. The median Rule of 40 jumped from 15% to 25%, the biggest single-year gain in five years. CAC payback improved too, from 18 months to 16.
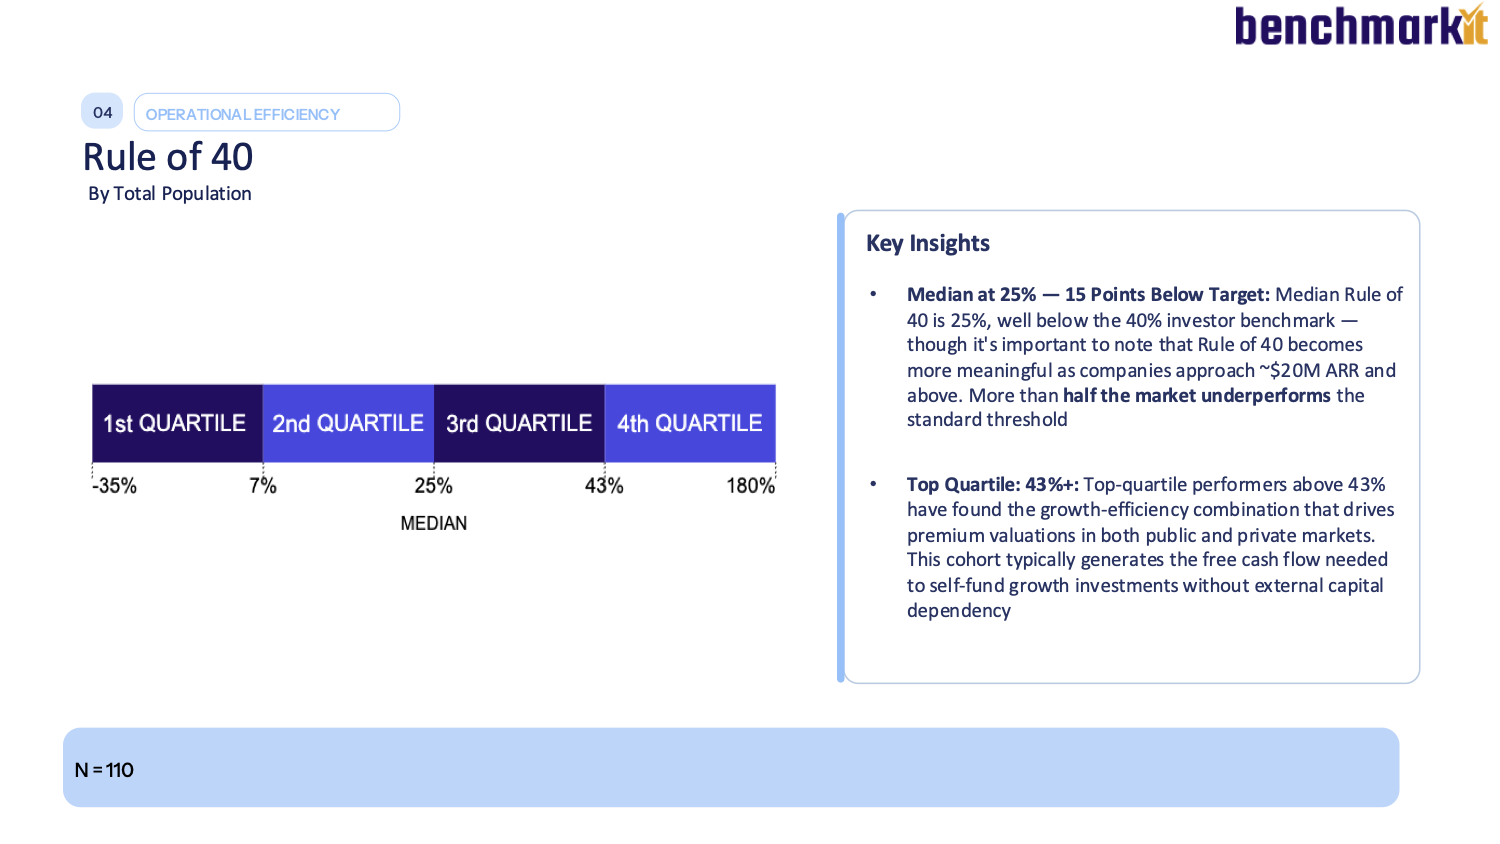
But how companies got there is more concerning. R&D—investments that theoretically promise future growth—fell from 35% of revenue to 27%. Sales and marketing came down too. In other words, companies got more efficient largely because they were investing less.
That would be easier to celebrate if the revenue side were getting stronger at the same time. But it wasn’t. Median growth fell from 26% to 20%, and gross revenue retention dropped from 88% to 84%.
This shows the limits of Rule of 40, and why it needs more context. An improved Rule of 40 driven by slower growth, weaker retention, and lower investment doesn’t paint a picture of perfect health.
That being said, cutting waste is a good thing. A lot of SaaS companies needed to reset their cost structures after the growth-at-all-costs years. But cost-line improvement has a ceiling—you can’t keep cutting your way to durable growth.
So yes, the recovery is real. But for a lot of companies, it looks more like breathing room than a new growth engine.
2. Seat-based pricing is under pressure
Companies with usage-based pricing posted median net revenue retention of 108% in 2025, while seat-based companies came in below the breakeven line at 98%.
That may not seem like a massive gap in one year. But over time, it’s the difference between a model that expands with customer value and one that constantly has to bring in new business just to keep ARR flat.
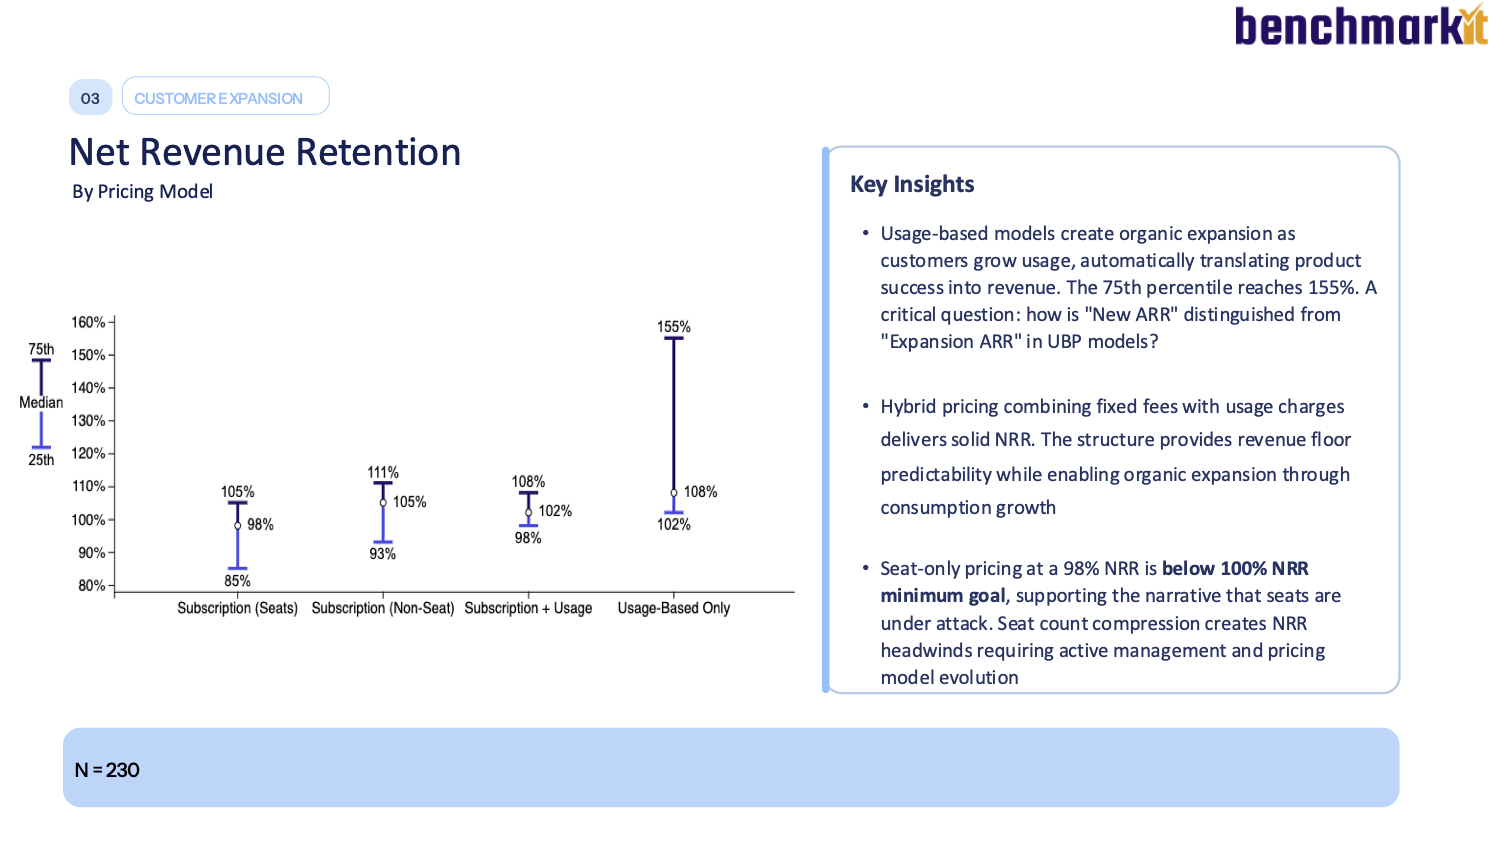
For years, seat-based pricing was the default SaaS motion. More users meant more revenue, and hiring growth translated into account growth. Expansion often came from getting more people inside the same company onto the platform.
AI complicates that logic.
If one person can do more with AI, seat count becomes a weaker proxy for value. And if AI agents start doing work that used to require additional users, the old expansion motion becomes less viable. While the customer is still getting value from the product, the pricing model isn’t capturing that value as naturally as it used to.
The upshot for SaaS operators is that pricing architecture needs to be a key focus. You can have the strongest sales team in the world, but if revenue only grows when seats grow, you’ll always be fighting an uphill battle.
That doesn’t mean that every seat-based company should become usage-based overnight. It’s not a great fit for every business, and it creates new challenges around packaging, forecasting, margin, and buyer predictability.
But the benchmark data makes one point hard to ignore: for seat-based companies, 2026 should be the year of real pricing experimentation.
3. Retention is flashing red
The most concerning metric in the report was gross revenue retention.
Median GRR fell to 84% in 2025, down from 90% just three years prior. Even top performers weren’t immune—the 75th percentile fell from 95% to 91%.
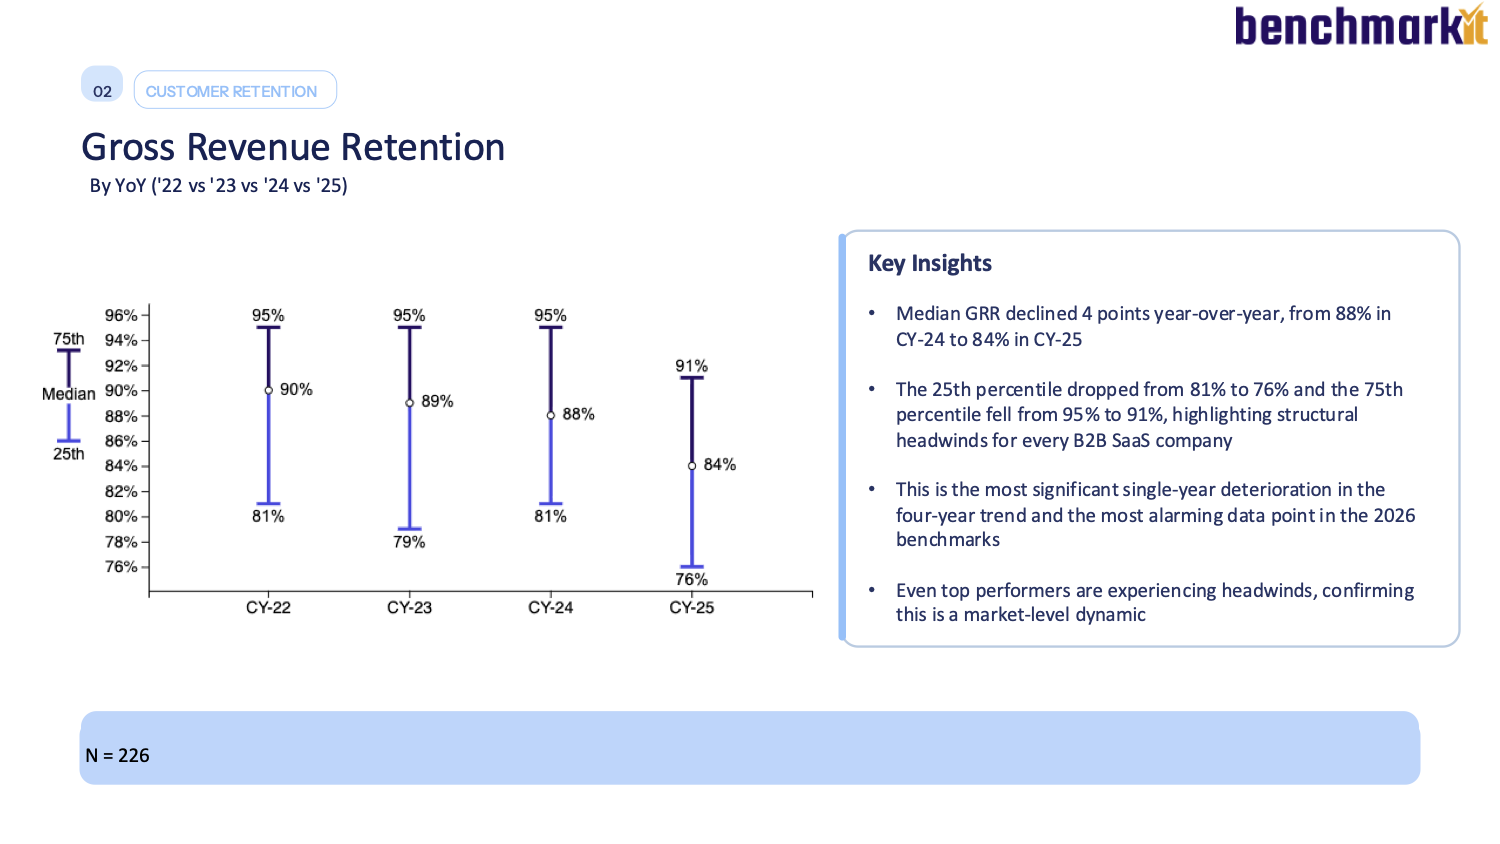
SaaS veterans know why GRR is such a critical metric: you can’t hide from it. Expansion can cover up retention problems for a while. New logo growth can keep the top line moving. But gross retention tells you whether customers are staying before upsells and new deals cover the leakage.
In 2025, that number moved the wrong way. And it looks less like a few companies missing their CS targets and more like a market-level shift.
Buyers are ruthlessly scrutinizing every renewal, wondering if Claude can do everything for them or if they should look at an AI-native competitor instead.
The industry-wide GRR decay should change how teams talk about retention internally. It’s not just a customer success metric. It’s a product metric, a pricing metric, a positioning metric, and a workflow-depth metric all rolled into one.
If customers are leaving or contracting, the question is not just “What did CS miss?”
It’s:
- Is the product embedded deeply enough?
- Is the value still obvious at renewal?
- Is the pricing model aligned with how customers actually use the product?
- Is the workflow defensible against newer AI-native alternatives?
Buyers are still figuring out what AI can and can’t replace. That uncertainty delays deals. To reverse the GRR trend, SaaS companies need to make the value case clearer, the workflow stickier, and the AI-era roadmap more credible before the renewal conversation starts.
4. AI’s initial returns are showing up in headcount, not revenue
The report shows clear signs of an AI productivity dividend. ARR per employee climbed 29% to $193K. This is also the flipside of the R&D story—along with some cost cutting, AI efficiency gains helped drive down R&D from 35% of revenue to 27%.
There’s a big divergence, though, in how companies are using these gains. The median company spends just 10% of its R&D budget on AI, while the top quartile spends 30% or more.
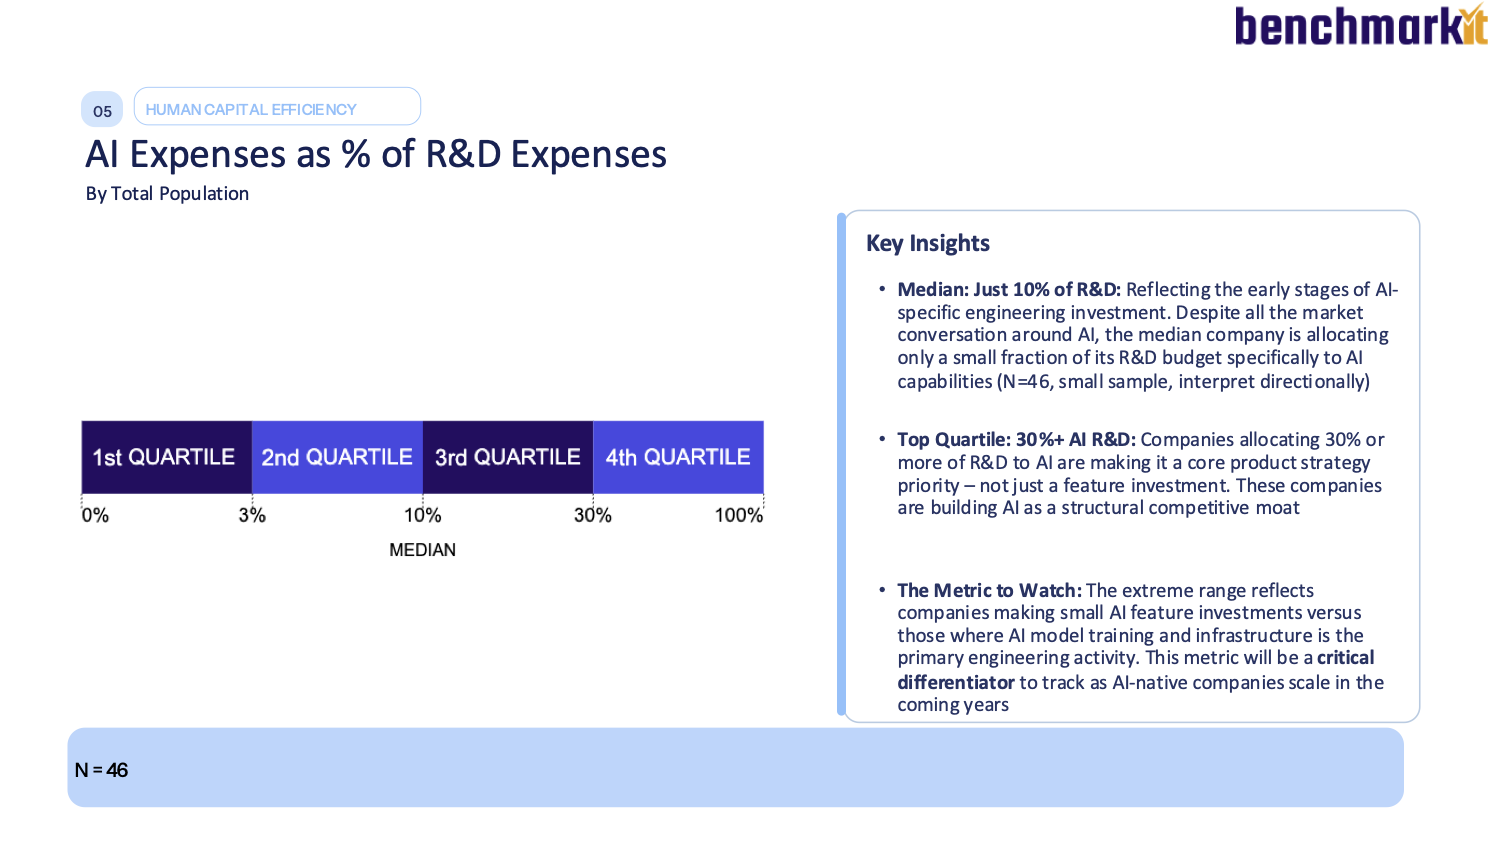
And the cost side hasn’t caught up yet. Software gross margin held at 80%, which means the AI bill (inference, new tooling, model subscriptions) hasn’t meaningfully dented unit economics so far. For now, companies are getting the productivity without really paying for it.
So the dividend is real. The question is what you do with it. Most companies are banking the efficiency, taking the lower R&D line as savings and moving on. A smaller group is feeding it back in, treating AI as something to build with rather than just save on. That 30%-of-R&D-on-AI figure from the top quartile isn’t really a spending stat. It’s the moat forming in real time, while everyone else counts the savings.
5. The efficiency dividend is a one-time thing, and the window is closing
You can only cut your way to efficiency once. The R&D and S&M reductions that powered 2025's Rule of 40 jump aren't repeatable. What SaaS leaders do with the freed-up capital now is what decides whether 2025 was a turning point or just a good year.
Broadly, companies are taking one of three paths.
- Path A: pocket the savings, protect margin.
- Path B: sprinkle it around—a little more AI tooling here, a pilot there, but nothing structural.
- Path C: redesign the operating model around what AI actually changes—how you price, how expansion works, how the finance function itself runs.
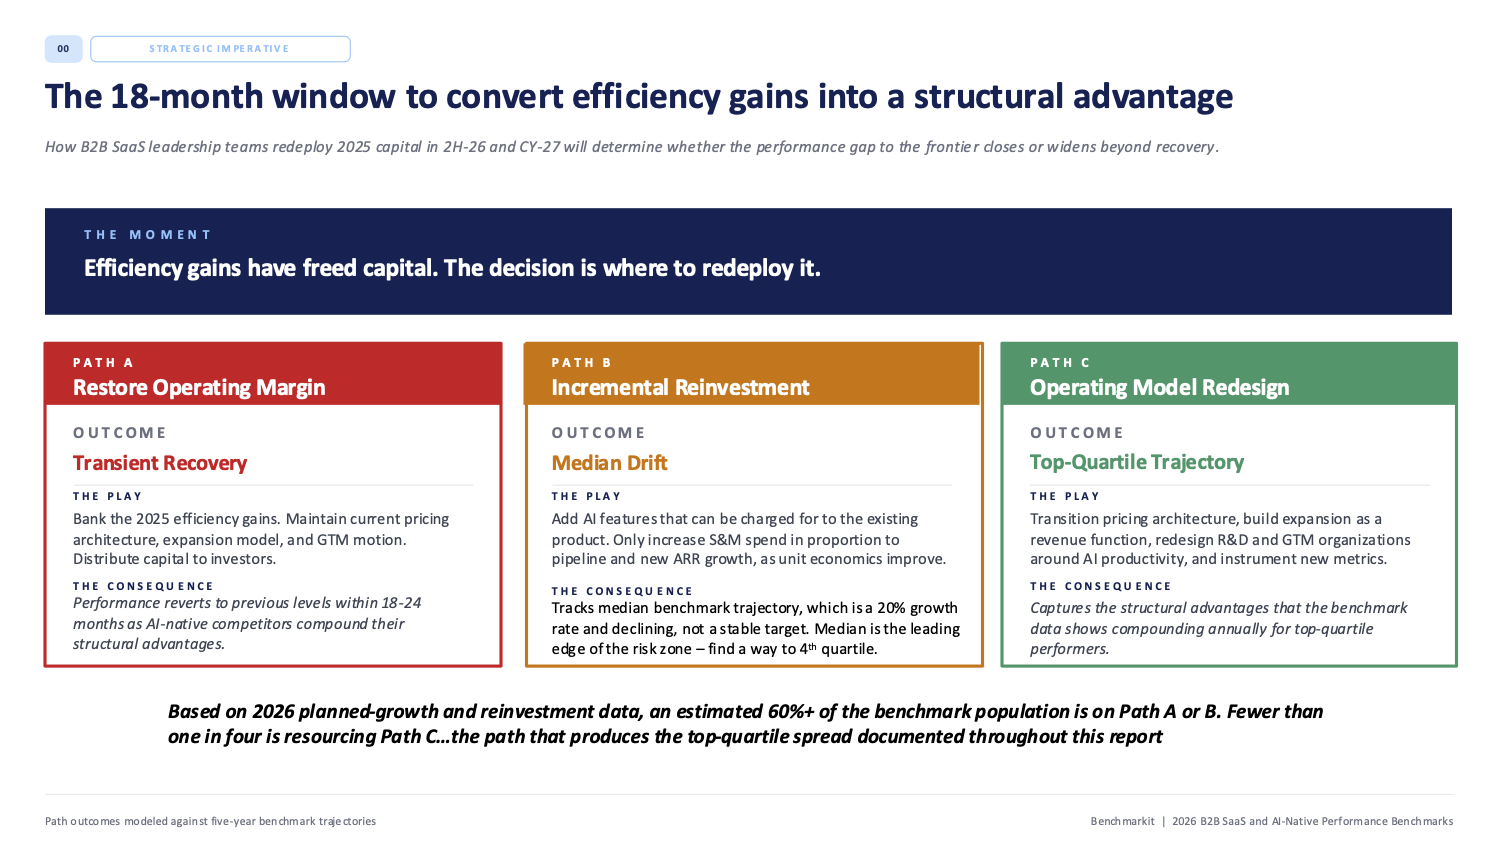
More than 60% of companies are on Path A or B, while fewer than one in four are resourcing Path C. The latter is the more difficult, expensive choice, but also the one most likely to lead to top-quartile growth.
Here’s the takeaway for the remainder of 2026: the efficiency you booked last year isn't a result you get to keep. It's a budget you get to spend once. Bank it and you get a cleaner P&L and a quiet slide back toward the median, which is where 20%-and-declining growth lives. Put it into the operating model and you get a real shot at the top quartile.
The benchmarks reward only one of those, and most of your competitors are choosing the other.
The catch is that Path C is, frankly, a finance problem. Repricing, modeling expansion as its own revenue function, and instrumenting the metrics that tell you any of it is working all run through the finance org.
The companies that pull it off won't be the ones with the flashiest AI roadmap. They'll be the ones who made the hard choice to invest the proceeds from a one-time efficiency gain into a durable AI advantage.
See where you stand with our interactive benchmarking tool
The median SaaS company got more efficient in 2025. The fine print is that a lot of that efficiency was bought, not earned—and the bill, in slower growth and leakier retention, is coming due. AI didn't cause all of it. But it's raising the bar on every metric that matters: how you price, how you retain, how you reinvest.
The full report gets into detail on all this and more. It breaks down all 30+ benchmarks by growth rate, ARR band, and pricing model, so you can see the real distance between the median and the top quartile on every metric that matters.
Better yet, see where you land yourself. Our interactive benchmarking tool drops your own numbers against the 342 companies in the dataset and tells you which of the three paths you're actually resourcing for 2026.
Get FP&A best practices, research reports, and more delivered to your inbox.


